Ecuadorian vs Immigrants from North America Median Household Income
COMPARE
Ecuadorian
Immigrants from North America
Median Household Income
Median Household Income Comparison
Ecuadorians
Immigrants from North America
$82,070
MEDIAN HOUSEHOLD INCOME
12.5/ 100
METRIC RATING
217th/ 347
METRIC RANK
$91,860
MEDIAN HOUSEHOLD INCOME
98.7/ 100
METRIC RATING
94th/ 347
METRIC RANK
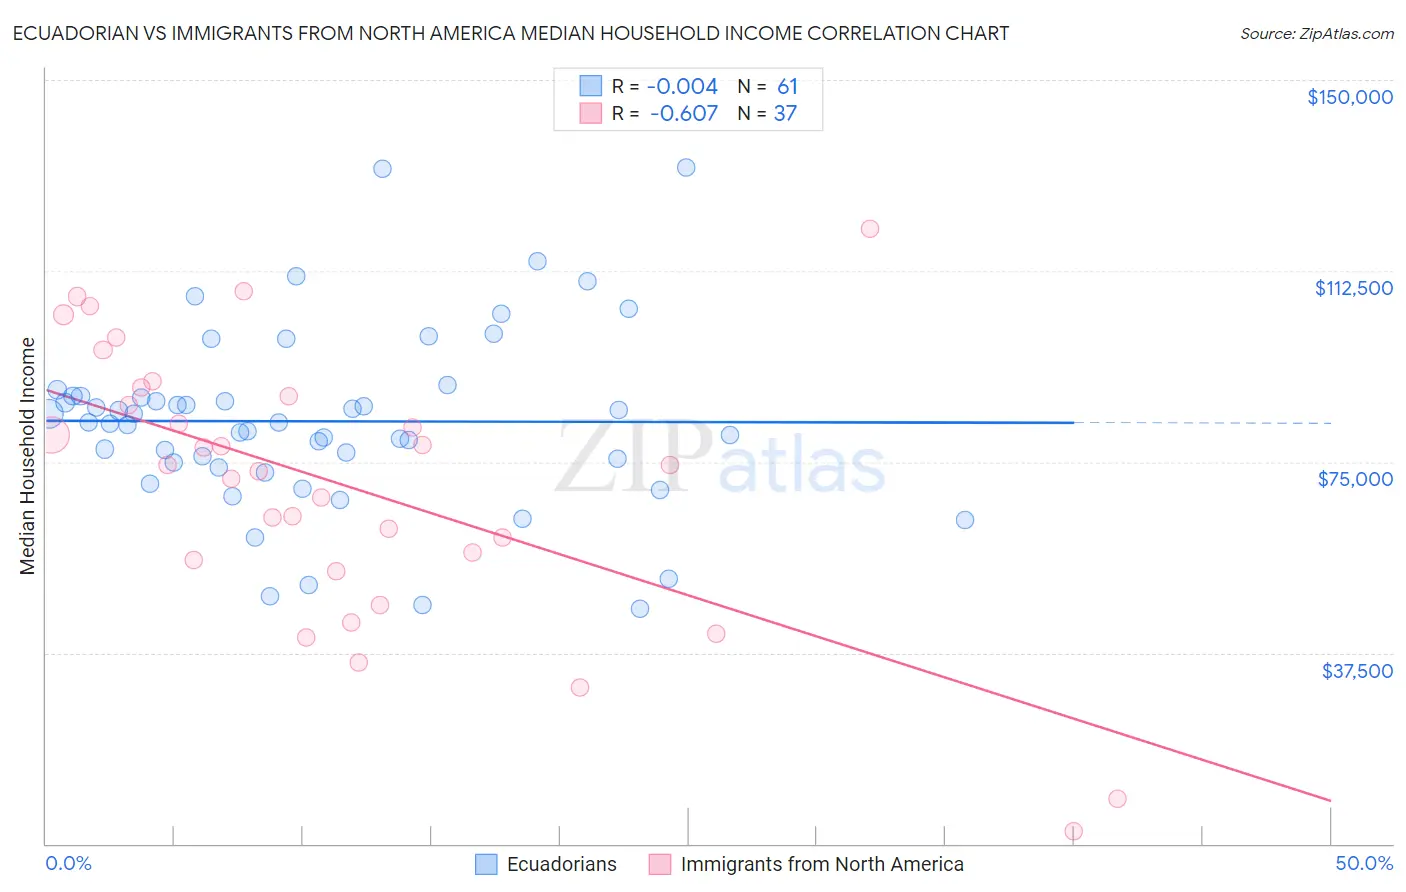
Ecuadorian vs Immigrants from North America Median Household Income Correlation Chart
The statistical analysis conducted on geographies consisting of 317,572,245 people shows no correlation between the proportion of Ecuadorians and median household income in the United States with a correlation coefficient (R) of -0.004 and weighted average of $82,070. Similarly, the statistical analysis conducted on geographies consisting of 462,084,352 people shows a significant negative correlation between the proportion of Immigrants from North America and median household income in the United States with a correlation coefficient (R) of -0.607 and weighted average of $91,860, a difference of 11.9%.
Median Household Income Correlation Summary
| Measurement | Ecuadorian | Immigrants from North America |
| Minimum | $46,188 | $2,499 |
| Maximum | $132,837 | $120,804 |
| Range | $86,649 | $118,305 |
| Mean | $82,960 | $70,374 |
| Median | $82,671 | $74,312 |
| Interquartile 25% (IQ1) | $74,469 | $54,648 |
| Interquartile 75% (IQ3) | $87,872 | $88,741 |
| Interquartile Range (IQR) | $13,403 | $34,094 |
| Standard Deviation (Sample) | $17,786 | $27,060 |
| Standard Deviation (Population) | $17,640 | $26,692 |
Similar Demographics by Median Household Income
Demographics Similar to Ecuadorians by Median Household Income
In terms of median household income, the demographic groups most similar to Ecuadorians are White/Caucasian ($82,029, a difference of 0.050%), Yugoslavian ($82,186, a difference of 0.14%), Vietnamese ($82,248, a difference of 0.22%), Panamanian ($82,272, a difference of 0.25%), and Nepalese ($82,410, a difference of 0.41%).
| Demographics | Rating | Rank | Median Household Income |
| Immigrants | Uruguay | 16.4 /100 | #210 | Poor $82,560 |
| Salvadorans | 15.4 /100 | #211 | Poor $82,449 |
| Venezuelans | 15.3 /100 | #212 | Poor $82,432 |
| Nepalese | 15.1 /100 | #213 | Poor $82,410 |
| Panamanians | 14.0 /100 | #214 | Poor $82,272 |
| Vietnamese | 13.8 /100 | #215 | Poor $82,248 |
| Yugoslavians | 13.3 /100 | #216 | Poor $82,186 |
| Ecuadorians | 12.5 /100 | #217 | Poor $82,070 |
| Whites/Caucasians | 12.2 /100 | #218 | Poor $82,029 |
| Nigerians | 10.3 /100 | #219 | Poor $81,725 |
| Immigrants | Venezuela | 9.0 /100 | #220 | Tragic $81,506 |
| Immigrants | Ghana | 9.0 /100 | #221 | Tragic $81,489 |
| Immigrants | Nigeria | 7.7 /100 | #222 | Tragic $81,236 |
| Immigrants | El Salvador | 7.6 /100 | #223 | Tragic $81,213 |
| Malaysians | 7.0 /100 | #224 | Tragic $81,064 |
Demographics Similar to Immigrants from North America by Median Household Income
In terms of median household income, the demographic groups most similar to Immigrants from North America are Immigrants from Lebanon ($91,887, a difference of 0.030%), Armenian ($91,807, a difference of 0.060%), Jordanian ($91,794, a difference of 0.070%), Immigrants from Western Europe ($91,936, a difference of 0.080%), and Assyrian/Chaldean/Syriac ($91,991, a difference of 0.14%).
| Demographics | Rating | Rank | Median Household Income |
| Immigrants | Hungary | 98.9 /100 | #87 | Exceptional $92,094 |
| Immigrants | Canada | 98.8 /100 | #88 | Exceptional $92,029 |
| Romanians | 98.8 /100 | #89 | Exceptional $91,994 |
| Assyrians/Chaldeans/Syriacs | 98.8 /100 | #90 | Exceptional $91,991 |
| Immigrants | Vietnam | 98.8 /100 | #91 | Exceptional $91,987 |
| Immigrants | Western Europe | 98.8 /100 | #92 | Exceptional $91,936 |
| Immigrants | Lebanon | 98.7 /100 | #93 | Exceptional $91,887 |
| Immigrants | North America | 98.7 /100 | #94 | Exceptional $91,860 |
| Armenians | 98.7 /100 | #95 | Exceptional $91,807 |
| Jordanians | 98.7 /100 | #96 | Exceptional $91,794 |
| Immigrants | Serbia | 98.6 /100 | #97 | Exceptional $91,730 |
| Immigrants | Southern Europe | 98.5 /100 | #98 | Exceptional $91,605 |
| Immigrants | South Eastern Asia | 98.4 /100 | #99 | Exceptional $91,541 |
| Ukrainians | 98.3 /100 | #100 | Exceptional $91,456 |
| Immigrants | Moldova | 98.3 /100 | #101 | Exceptional $91,446 |