Bangladeshi vs Assyrian/Chaldean/Syriac Householder Income Over 65 years
COMPARE
Bangladeshi
Assyrian/Chaldean/Syriac
Householder Income Over 65 years
Householder Income Over 65 years Comparison
Bangladeshis
Assyrians/Chaldeans/Syriacs
$54,719
HOUSEHOLDER INCOME OVER 65 YEARS
0.1/ 100
METRIC RATING
262nd/ 347
METRIC RANK
$64,108
HOUSEHOLDER INCOME OVER 65 YEARS
96.4/ 100
METRIC RATING
99th/ 347
METRIC RANK
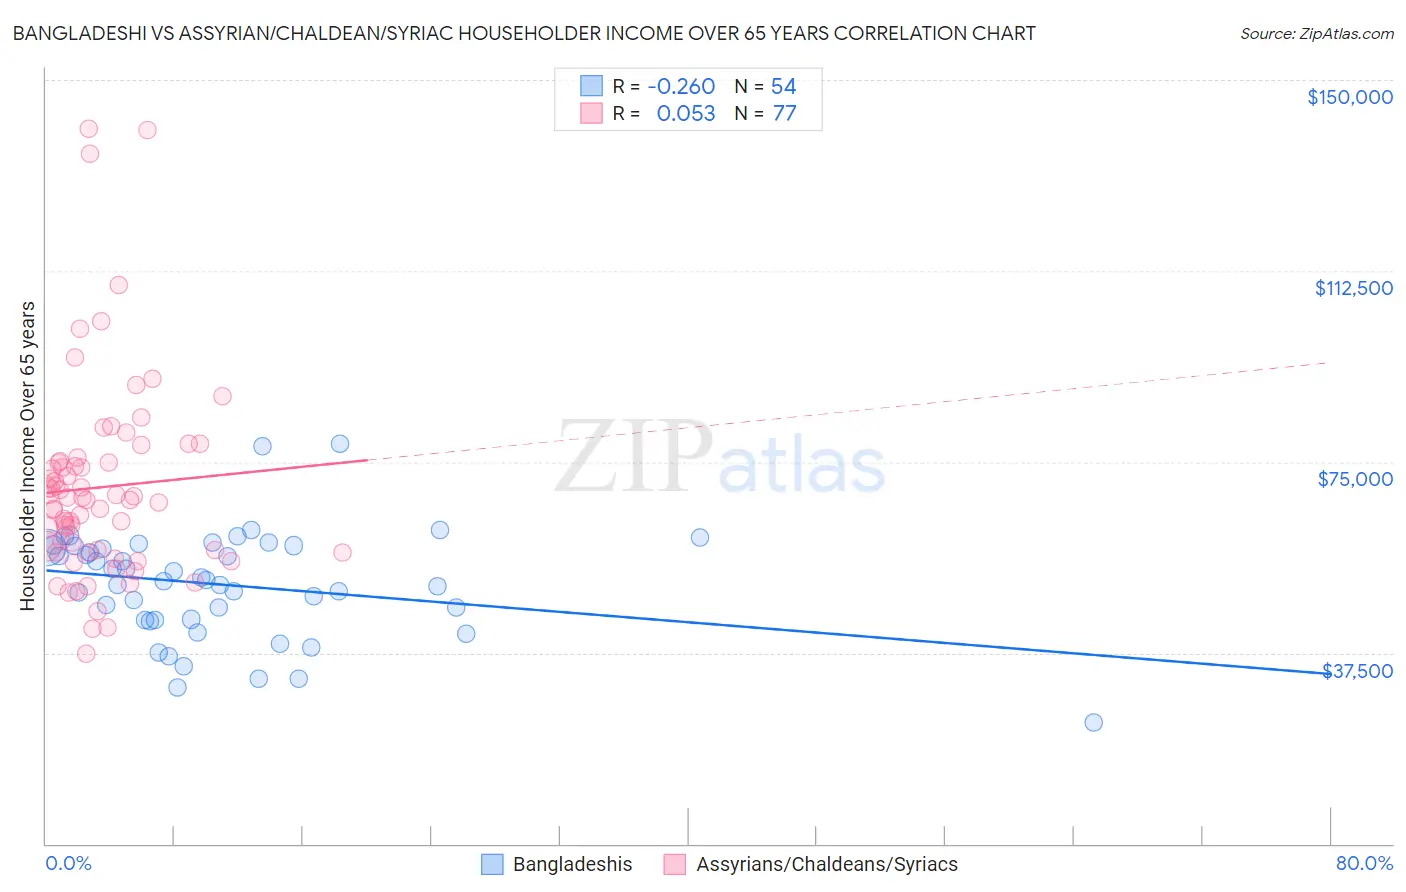
Bangladeshi vs Assyrian/Chaldean/Syriac Householder Income Over 65 years Correlation Chart
The statistical analysis conducted on geographies consisting of 140,913,932 people shows a weak negative correlation between the proportion of Bangladeshis and household income with householder over the age of 65 in the United States with a correlation coefficient (R) of -0.260 and weighted average of $54,719. Similarly, the statistical analysis conducted on geographies consisting of 110,223,664 people shows a slight positive correlation between the proportion of Assyrians/Chaldeans/Syriacs and household income with householder over the age of 65 in the United States with a correlation coefficient (R) of 0.053 and weighted average of $64,108, a difference of 17.2%.
Householder Income Over 65 years Correlation Summary
| Measurement | Bangladeshi | Assyrian/Chaldean/Syriac |
| Minimum | $23,750 | $37,310 |
| Maximum | $78,500 | $140,431 |
| Range | $54,750 | $103,121 |
| Mean | $50,859 | $70,014 |
| Median | $51,575 | $67,459 |
| Interquartile 25% (IQ1) | $43,904 | $57,422 |
| Interquartile 75% (IQ3) | $58,421 | $75,038 |
| Interquartile Range (IQR) | $14,517 | $17,616 |
| Standard Deviation (Sample) | $10,619 | $19,596 |
| Standard Deviation (Population) | $10,520 | $19,468 |
Similar Demographics by Householder Income Over 65 years
Demographics Similar to Bangladeshis by Householder Income Over 65 years
In terms of householder income over 65 years, the demographic groups most similar to Bangladeshis are French American Indian ($54,699, a difference of 0.040%), Apache ($54,668, a difference of 0.090%), Belizean ($54,580, a difference of 0.25%), Jamaican ($54,560, a difference of 0.29%), and Guatemalan ($54,526, a difference of 0.35%).
| Demographics | Rating | Rank | Householder Income Over 65 years |
| Immigrants | Bangladesh | 0.3 /100 | #255 | Tragic $55,394 |
| German Russians | 0.3 /100 | #256 | Tragic $55,356 |
| Trinidadians and Tobagonians | 0.3 /100 | #257 | Tragic $55,327 |
| Ecuadorians | 0.2 /100 | #258 | Tragic $54,958 |
| West Indians | 0.2 /100 | #259 | Tragic $54,936 |
| Immigrants | West Indies | 0.2 /100 | #260 | Tragic $54,927 |
| Comanche | 0.2 /100 | #261 | Tragic $54,922 |
| Bangladeshis | 0.1 /100 | #262 | Tragic $54,719 |
| French American Indians | 0.1 /100 | #263 | Tragic $54,699 |
| Apache | 0.1 /100 | #264 | Tragic $54,668 |
| Belizeans | 0.1 /100 | #265 | Tragic $54,580 |
| Jamaicans | 0.1 /100 | #266 | Tragic $54,560 |
| Guatemalans | 0.1 /100 | #267 | Tragic $54,526 |
| Immigrants | Zaire | 0.1 /100 | #268 | Tragic $54,512 |
| Nicaraguans | 0.1 /100 | #269 | Tragic $54,474 |
Demographics Similar to Assyrians/Chaldeans/Syriacs by Householder Income Over 65 years
In terms of householder income over 65 years, the demographic groups most similar to Assyrians/Chaldeans/Syriacs are Immigrants from South Eastern Asia ($64,089, a difference of 0.030%), Romanian ($64,142, a difference of 0.050%), Immigrants from Italy ($64,065, a difference of 0.070%), Sri Lankan ($64,201, a difference of 0.14%), and Chilean ($63,957, a difference of 0.24%).
| Demographics | Rating | Rank | Householder Income Over 65 years |
| Immigrants | Bulgaria | 97.3 /100 | #92 | Exceptional $64,379 |
| Jordanians | 97.1 /100 | #93 | Exceptional $64,313 |
| Immigrants | Egypt | 97.0 /100 | #94 | Exceptional $64,299 |
| Immigrants | Latvia | 97.0 /100 | #95 | Exceptional $64,298 |
| Immigrants | Hungary | 97.0 /100 | #96 | Exceptional $64,277 |
| Sri Lankans | 96.7 /100 | #97 | Exceptional $64,201 |
| Romanians | 96.5 /100 | #98 | Exceptional $64,142 |
| Assyrians/Chaldeans/Syriacs | 96.4 /100 | #99 | Exceptional $64,108 |
| Immigrants | South Eastern Asia | 96.3 /100 | #100 | Exceptional $64,089 |
| Immigrants | Italy | 96.2 /100 | #101 | Exceptional $64,065 |
| Chileans | 95.8 /100 | #102 | Exceptional $63,957 |
| British | 95.7 /100 | #103 | Exceptional $63,940 |
| Immigrants | Cameroon | 95.6 /100 | #104 | Exceptional $63,907 |
| Italians | 95.5 /100 | #105 | Exceptional $63,885 |
| Immigrants | Argentina | 95.5 /100 | #106 | Exceptional $63,885 |