Immigrants from Israel vs Immigrants from Italy Cognitive Disability
COMPARE
Immigrants from Israel
Immigrants from Italy
Cognitive Disability
Cognitive Disability Comparison
Immigrants from Israel
Immigrants from Italy
16.4%
COGNITIVE DISABILITY
99.9/ 100
METRIC RATING
32nd/ 347
METRIC RANK
16.5%
COGNITIVE DISABILITY
99.8/ 100
METRIC RATING
47th/ 347
METRIC RANK
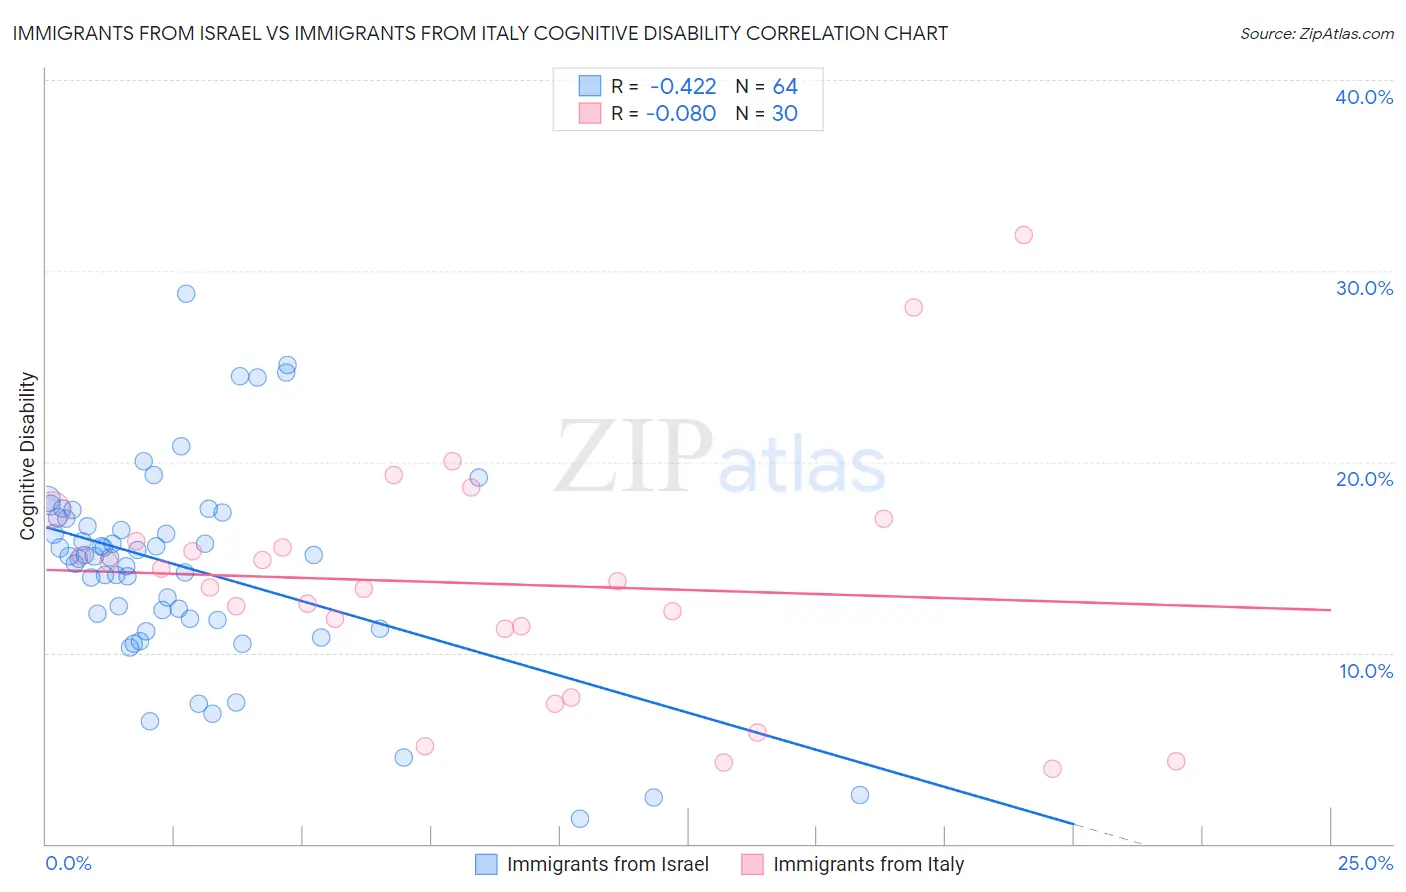
Immigrants from Israel vs Immigrants from Italy Cognitive Disability Correlation Chart
The statistical analysis conducted on geographies consisting of 210,028,884 people shows a moderate negative correlation between the proportion of Immigrants from Israel and percentage of population with cognitive disability in the United States with a correlation coefficient (R) of -0.422 and weighted average of 16.4%. Similarly, the statistical analysis conducted on geographies consisting of 324,202,765 people shows a slight negative correlation between the proportion of Immigrants from Italy and percentage of population with cognitive disability in the United States with a correlation coefficient (R) of -0.080 and weighted average of 16.5%, a difference of 0.57%.
Cognitive Disability Correlation Summary
| Measurement | Immigrants from Israel | Immigrants from Italy |
| Minimum | 1.3% | 3.9% |
| Maximum | 28.8% | 31.9% |
| Range | 27.5% | 27.9% |
| Mean | 14.5% | 13.6% |
| Median | 15.1% | 13.6% |
| Interquartile 25% (IQ1) | 11.8% | 11.3% |
| Interquartile 75% (IQ3) | 17.0% | 15.9% |
| Interquartile Range (IQR) | 5.3% | 4.6% |
| Standard Deviation (Sample) | 5.3% | 6.4% |
| Standard Deviation (Population) | 5.2% | 6.3% |
Demographics Similar to Immigrants from Israel and Immigrants from Italy by Cognitive Disability
In terms of cognitive disability, the demographic groups most similar to Immigrants from Israel are Immigrants from Romania (16.4%, a difference of 0.050%), Czech (16.4%, a difference of 0.070%), Italian (16.4%, a difference of 0.070%), Filipino (16.4%, a difference of 0.080%), and Russian (16.4%, a difference of 0.080%). Similarly, the demographic groups most similar to Immigrants from Italy are Immigrants from North America (16.5%, a difference of 0.0%), Immigrants from Colombia (16.5%, a difference of 0.030%), Immigrants from Europe (16.5%, a difference of 0.040%), Iranian (16.5%, a difference of 0.040%), and Macedonian (16.5%, a difference of 0.050%).
| Demographics | Rating | Rank | Cognitive Disability |
| Filipinos | 99.9 /100 | #29 | Exceptional 16.4% |
| Czechs | 99.9 /100 | #30 | Exceptional 16.4% |
| Immigrants | Romania | 99.9 /100 | #31 | Exceptional 16.4% |
| Immigrants | Israel | 99.9 /100 | #32 | Exceptional 16.4% |
| Italians | 99.9 /100 | #33 | Exceptional 16.4% |
| Russians | 99.9 /100 | #34 | Exceptional 16.4% |
| Slovaks | 99.9 /100 | #35 | Exceptional 16.4% |
| Greeks | 99.9 /100 | #36 | Exceptional 16.4% |
| Slovenes | 99.9 /100 | #37 | Exceptional 16.5% |
| Immigrants | Eastern Europe | 99.9 /100 | #38 | Exceptional 16.5% |
| Bolivians | 99.9 /100 | #39 | Exceptional 16.5% |
| Immigrants | Belarus | 99.9 /100 | #40 | Exceptional 16.5% |
| Cubans | 99.9 /100 | #41 | Exceptional 16.5% |
| Hungarians | 99.9 /100 | #42 | Exceptional 16.5% |
| Immigrants | Canada | 99.8 /100 | #43 | Exceptional 16.5% |
| Macedonians | 99.8 /100 | #44 | Exceptional 16.5% |
| Immigrants | Europe | 99.8 /100 | #45 | Exceptional 16.5% |
| Immigrants | Colombia | 99.8 /100 | #46 | Exceptional 16.5% |
| Immigrants | Italy | 99.8 /100 | #47 | Exceptional 16.5% |
| Immigrants | North America | 99.8 /100 | #48 | Exceptional 16.5% |
| Iranians | 99.8 /100 | #49 | Exceptional 16.5% |