Immigrants from Israel vs Immigrants from Italy Family Households with Children
COMPARE
Immigrants from Israel
Immigrants from Italy
Family Households with Children
Family Households with Children Comparison
Immigrants from Israel
Immigrants from Italy
27.4%
FAMILY HOUSEHOLDS WITH CHILDREN
37.9/ 100
METRIC RATING
189th/ 347
METRIC RANK
27.0%
FAMILY HOUSEHOLDS WITH CHILDREN
5.0/ 100
METRIC RATING
233rd/ 347
METRIC RANK
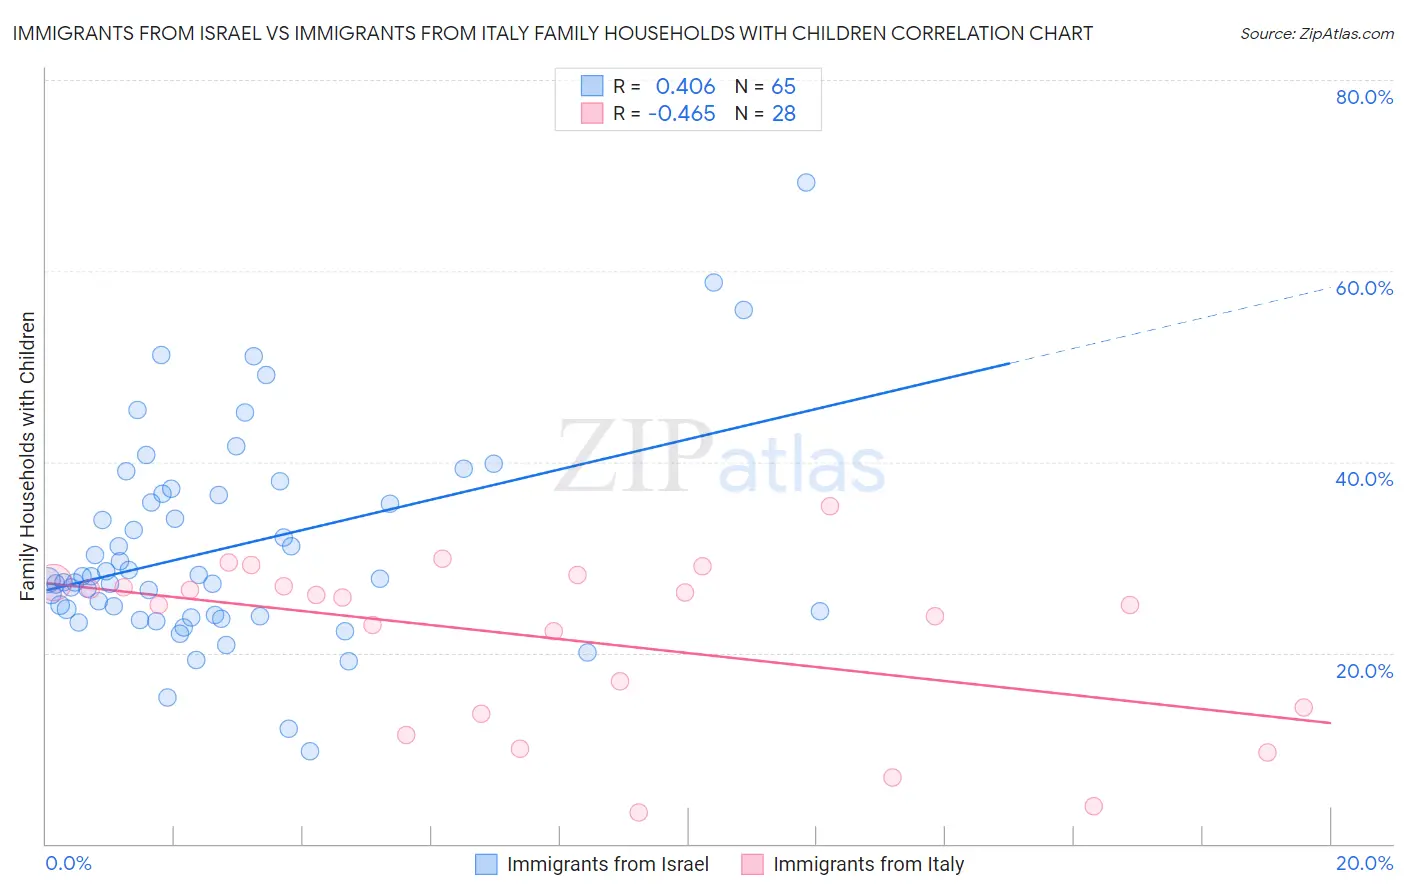
Immigrants from Israel vs Immigrants from Italy Family Households with Children Correlation Chart
The statistical analysis conducted on geographies consisting of 209,857,521 people shows a moderate positive correlation between the proportion of Immigrants from Israel and percentage of family households with children in the United States with a correlation coefficient (R) of 0.406 and weighted average of 27.4%. Similarly, the statistical analysis conducted on geographies consisting of 323,996,481 people shows a moderate negative correlation between the proportion of Immigrants from Italy and percentage of family households with children in the United States with a correlation coefficient (R) of -0.465 and weighted average of 27.0%, a difference of 1.4%.
Family Households with Children Correlation Summary
| Measurement | Immigrants from Israel | Immigrants from Italy |
| Minimum | 9.6% | 3.3% |
| Maximum | 69.2% | 35.3% |
| Range | 59.6% | 32.0% |
| Mean | 31.0% | 21.5% |
| Median | 27.7% | 25.4% |
| Interquartile 25% (IQ1) | 23.9% | 13.9% |
| Interquartile 75% (IQ3) | 36.6% | 27.2% |
| Interquartile Range (IQR) | 12.7% | 13.2% |
| Standard Deviation (Sample) | 10.9% | 8.8% |
| Standard Deviation (Population) | 10.8% | 8.6% |
Similar Demographics by Family Households with Children
Demographics Similar to Immigrants from Israel by Family Households with Children
In terms of family households with children, the demographic groups most similar to Immigrants from Israel are Immigrants from Uruguay (27.4%, a difference of 0.010%), Sudanese (27.4%, a difference of 0.010%), Pennsylvania German (27.4%, a difference of 0.010%), Dutch (27.4%, a difference of 0.020%), and Swedish (27.4%, a difference of 0.020%).
| Demographics | Rating | Rank | Family Households with Children |
| Puget Sound Salish | 46.2 /100 | #182 | Average 27.4% |
| South Africans | 44.9 /100 | #183 | Average 27.4% |
| Native Hawaiians | 44.6 /100 | #184 | Average 27.4% |
| Delaware | 42.0 /100 | #185 | Average 27.4% |
| Immigrants | Brazil | 40.6 /100 | #186 | Average 27.4% |
| Creek | 39.8 /100 | #187 | Fair 27.4% |
| Dutch | 38.8 /100 | #188 | Fair 27.4% |
| Immigrants | Israel | 37.9 /100 | #189 | Fair 27.4% |
| Immigrants | Uruguay | 37.7 /100 | #190 | Fair 27.4% |
| Sudanese | 37.6 /100 | #191 | Fair 27.4% |
| Pennsylvania Germans | 37.5 /100 | #192 | Fair 27.4% |
| Swedes | 36.9 /100 | #193 | Fair 27.4% |
| Immigrants | Iran | 36.1 /100 | #194 | Fair 27.4% |
| Crow | 35.7 /100 | #195 | Fair 27.4% |
| Cheyenne | 35.1 /100 | #196 | Fair 27.4% |
Demographics Similar to Immigrants from Italy by Family Households with Children
In terms of family households with children, the demographic groups most similar to Immigrants from Italy are Yugoslavian (27.0%, a difference of 0.0%), Luxembourger (27.0%, a difference of 0.050%), Bulgarian (27.0%, a difference of 0.080%), Immigrants from Germany (27.0%, a difference of 0.080%), and Immigrants from Morocco (27.0%, a difference of 0.11%).
| Demographics | Rating | Rank | Family Households with Children |
| Czechoslovakians | 6.6 /100 | #226 | Tragic 27.0% |
| Tsimshian | 6.6 /100 | #227 | Tragic 27.0% |
| Scottish | 6.5 /100 | #228 | Tragic 27.0% |
| Immigrants | Caribbean | 6.3 /100 | #229 | Tragic 27.0% |
| Bulgarians | 5.8 /100 | #230 | Tragic 27.0% |
| Luxembourgers | 5.5 /100 | #231 | Tragic 27.0% |
| Yugoslavians | 5.1 /100 | #232 | Tragic 27.0% |
| Immigrants | Italy | 5.0 /100 | #233 | Tragic 27.0% |
| Immigrants | Germany | 4.4 /100 | #234 | Tragic 27.0% |
| Immigrants | Morocco | 4.2 /100 | #235 | Tragic 27.0% |
| Cape Verdeans | 3.6 /100 | #236 | Tragic 26.9% |
| Immigrants | Netherlands | 3.5 /100 | #237 | Tragic 26.9% |
| Moroccans | 3.4 /100 | #238 | Tragic 26.9% |
| Immigrants | Southern Europe | 3.4 /100 | #239 | Tragic 26.9% |
| Immigrants | Bulgaria | 3.3 /100 | #240 | Tragic 26.9% |