Immigrants from Israel vs Peruvian Median Male Earnings
COMPARE
Immigrants from Israel
Peruvian
Median Male Earnings
Median Male Earnings Comparison
Immigrants from Israel
Peruvians
$68,716
MEDIAN MALE EARNINGS
100.0/ 100
METRIC RATING
10th/ 347
METRIC RANK
$55,659
MEDIAN MALE EARNINGS
75.8/ 100
METRIC RATING
152nd/ 347
METRIC RANK
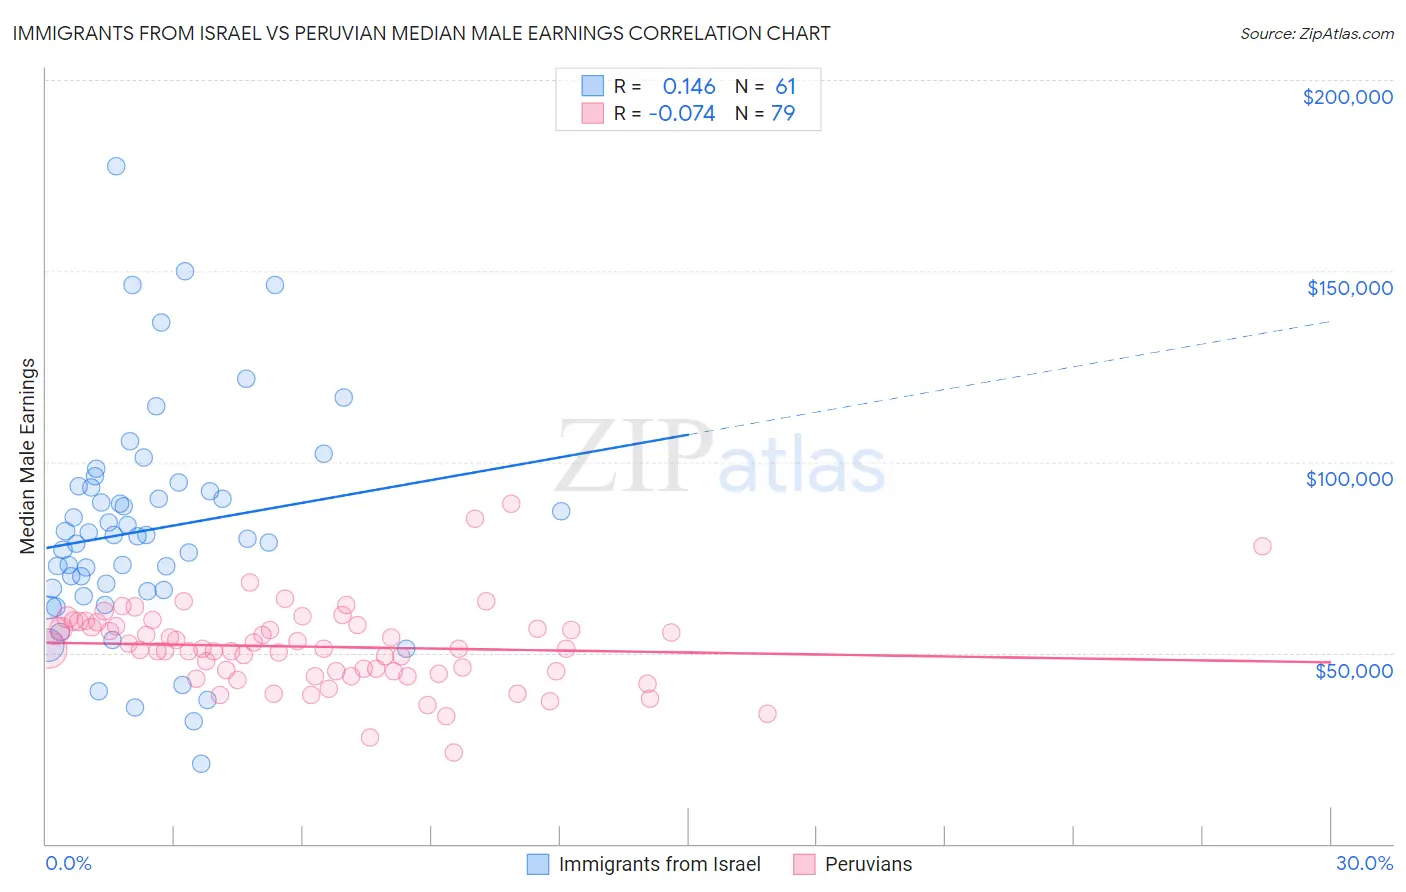
Immigrants from Israel vs Peruvian Median Male Earnings Correlation Chart
The statistical analysis conducted on geographies consisting of 209,997,525 people shows a poor positive correlation between the proportion of Immigrants from Israel and median male earnings in the United States with a correlation coefficient (R) of 0.146 and weighted average of $68,716. Similarly, the statistical analysis conducted on geographies consisting of 363,195,834 people shows a slight negative correlation between the proportion of Peruvians and median male earnings in the United States with a correlation coefficient (R) of -0.074 and weighted average of $55,659, a difference of 23.5%.
Median Male Earnings Correlation Summary
| Measurement | Immigrants from Israel | Peruvian |
| Minimum | $21,056 | $23,965 |
| Maximum | $177,500 | $89,196 |
| Range | $156,444 | $65,231 |
| Mean | $82,160 | $51,595 |
| Median | $80,676 | $51,069 |
| Interquartile 25% (IQ1) | $66,232 | $45,232 |
| Interquartile 75% (IQ3) | $93,582 | $57,176 |
| Interquartile Range (IQR) | $27,350 | $11,944 |
| Standard Deviation (Sample) | $29,382 | $10,827 |
| Standard Deviation (Population) | $29,141 | $10,758 |
Similar Demographics by Median Male Earnings
Demographics Similar to Immigrants from Israel by Median Male Earnings
In terms of median male earnings, the demographic groups most similar to Immigrants from Israel are Immigrants from South Central Asia ($68,960, a difference of 0.35%), Immigrants from Iran ($69,284, a difference of 0.83%), Immigrants from Ireland ($67,698, a difference of 1.5%), Immigrants from Australia ($67,634, a difference of 1.6%), and Immigrants from China ($67,353, a difference of 2.0%).
| Demographics | Rating | Rank | Median Male Earnings |
| Immigrants | Taiwan | 100.0 /100 | #3 | Exceptional $74,031 |
| Thais | 100.0 /100 | #4 | Exceptional $72,135 |
| Immigrants | Singapore | 100.0 /100 | #5 | Exceptional $71,348 |
| Iranians | 100.0 /100 | #6 | Exceptional $70,648 |
| Immigrants | Hong Kong | 100.0 /100 | #7 | Exceptional $70,146 |
| Immigrants | Iran | 100.0 /100 | #8 | Exceptional $69,284 |
| Immigrants | South Central Asia | 100.0 /100 | #9 | Exceptional $68,960 |
| Immigrants | Israel | 100.0 /100 | #10 | Exceptional $68,716 |
| Immigrants | Ireland | 100.0 /100 | #11 | Exceptional $67,698 |
| Immigrants | Australia | 100.0 /100 | #12 | Exceptional $67,634 |
| Immigrants | China | 100.0 /100 | #13 | Exceptional $67,353 |
| Okinawans | 100.0 /100 | #14 | Exceptional $67,232 |
| Immigrants | Eastern Asia | 100.0 /100 | #15 | Exceptional $66,903 |
| Eastern Europeans | 100.0 /100 | #16 | Exceptional $66,472 |
| Immigrants | Belgium | 100.0 /100 | #17 | Exceptional $66,125 |
Demographics Similar to Peruvians by Median Male Earnings
In terms of median male earnings, the demographic groups most similar to Peruvians are Immigrants from Nepal ($55,615, a difference of 0.080%), Immigrants from Oceania ($55,712, a difference of 0.10%), Swiss ($55,731, a difference of 0.13%), English ($55,747, a difference of 0.16%), and Taiwanese ($55,556, a difference of 0.19%).
| Demographics | Rating | Rank | Median Male Earnings |
| Norwegians | 80.9 /100 | #145 | Excellent $55,965 |
| Immigrants | Chile | 80.7 /100 | #146 | Excellent $55,954 |
| Immigrants | Philippines | 78.4 /100 | #147 | Good $55,809 |
| Scottish | 78.2 /100 | #148 | Good $55,793 |
| English | 77.4 /100 | #149 | Good $55,747 |
| Swiss | 77.1 /100 | #150 | Good $55,731 |
| Immigrants | Oceania | 76.8 /100 | #151 | Good $55,712 |
| Peruvians | 75.8 /100 | #152 | Good $55,659 |
| Immigrants | Nepal | 75.0 /100 | #153 | Good $55,615 |
| Taiwanese | 73.9 /100 | #154 | Good $55,556 |
| Scandinavians | 73.4 /100 | #155 | Good $55,527 |
| Immigrants | Ethiopia | 71.6 /100 | #156 | Good $55,434 |
| Icelanders | 71.2 /100 | #157 | Good $55,415 |
| Czechoslovakians | 70.5 /100 | #158 | Good $55,382 |
| Alsatians | 70.5 /100 | #159 | Good $55,380 |