Immigrants from Ireland vs Sierra Leonean Householder Income Ages 25 - 44 years
COMPARE
Immigrants from Ireland
Sierra Leonean
Householder Income Ages 25 - 44 years
Householder Income Ages 25 - 44 years Comparison
Immigrants from Ireland
Sierra Leoneans
$120,333
HOUSEHOLDER INCOME AGES 25 - 44 YEARS
100.0/ 100
METRIC RATING
7th/ 347
METRIC RANK
$93,435
HOUSEHOLDER INCOME AGES 25 - 44 YEARS
34.8/ 100
METRIC RATING
186th/ 347
METRIC RANK
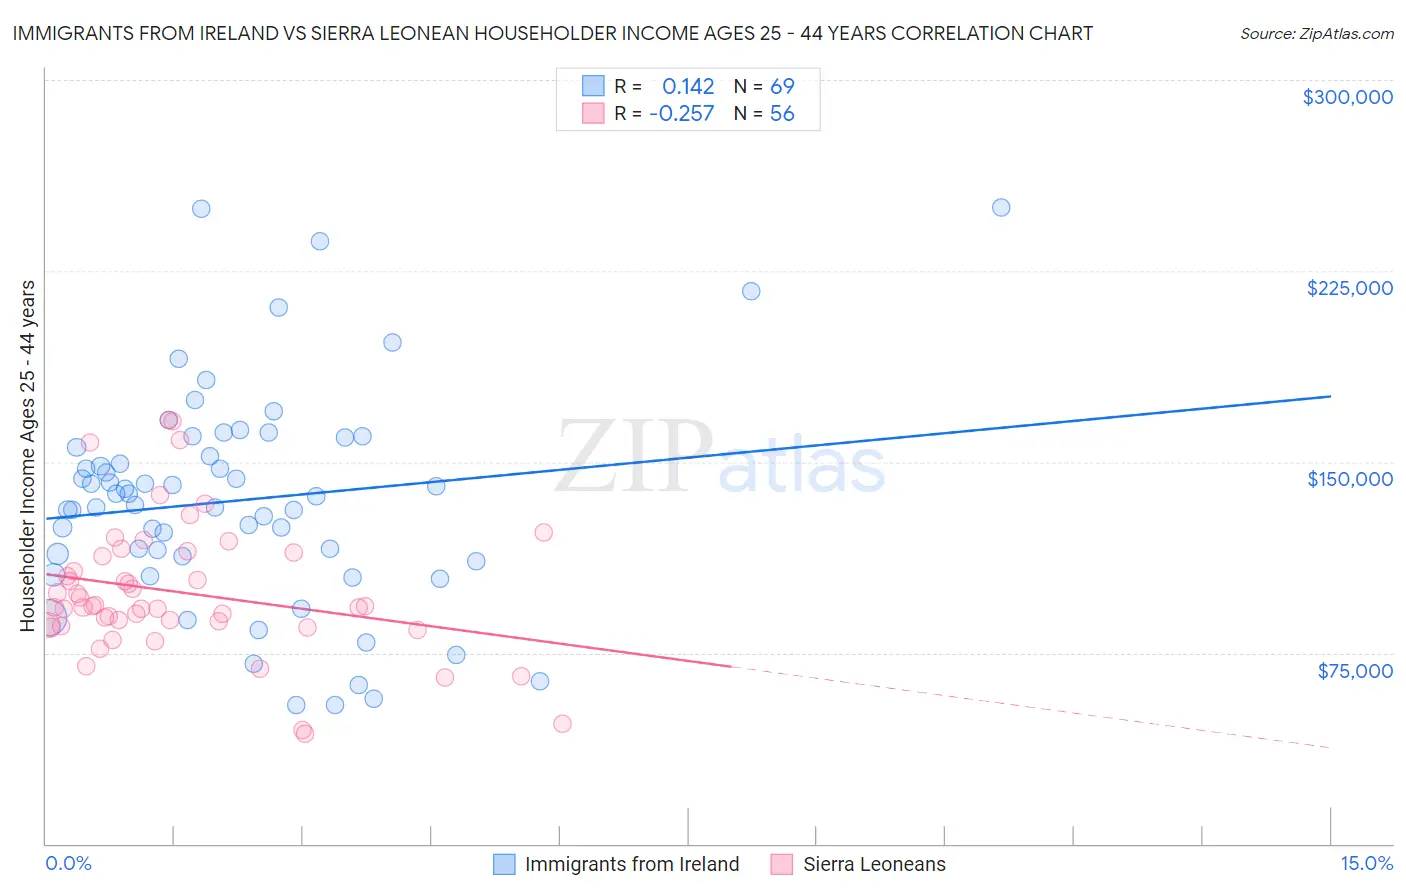
Immigrants from Ireland vs Sierra Leonean Householder Income Ages 25 - 44 years Correlation Chart
The statistical analysis conducted on geographies consisting of 240,342,740 people shows a poor positive correlation between the proportion of Immigrants from Ireland and household income with householder between the ages 25 and 44 in the United States with a correlation coefficient (R) of 0.142 and weighted average of $120,333. Similarly, the statistical analysis conducted on geographies consisting of 83,314,226 people shows a weak negative correlation between the proportion of Sierra Leoneans and household income with householder between the ages 25 and 44 in the United States with a correlation coefficient (R) of -0.257 and weighted average of $93,435, a difference of 28.8%.
Householder Income Ages 25 - 44 years Correlation Summary
| Measurement | Immigrants from Ireland | Sierra Leonean |
| Minimum | $54,479 | $43,346 |
| Maximum | $250,001 | $166,389 |
| Range | $195,522 | $123,043 |
| Mean | $134,959 | $98,723 |
| Median | $136,656 | $93,030 |
| Interquartile 25% (IQ1) | $112,137 | $85,860 |
| Interquartile 75% (IQ3) | $157,677 | $113,651 |
| Interquartile Range (IQR) | $45,540 | $27,791 |
| Standard Deviation (Sample) | $42,676 | $26,448 |
| Standard Deviation (Population) | $42,366 | $26,211 |
Similar Demographics by Householder Income Ages 25 - 44 years
Demographics Similar to Immigrants from Ireland by Householder Income Ages 25 - 44 years
In terms of householder income ages 25 - 44 years, the demographic groups most similar to Immigrants from Ireland are Iranian ($120,292, a difference of 0.030%), Immigrants from China ($119,756, a difference of 0.48%), Indian (Asian) ($119,496, a difference of 0.70%), Okinawan ($119,349, a difference of 0.82%), and Immigrants from Iran ($119,204, a difference of 0.95%).
| Demographics | Rating | Rank | Householder Income Ages 25 - 44 years |
| Immigrants | Taiwan | 100.0 /100 | #1 | Exceptional $129,122 |
| Filipinos | 100.0 /100 | #2 | Exceptional $128,723 |
| Immigrants | Hong Kong | 100.0 /100 | #3 | Exceptional $128,140 |
| Immigrants | Singapore | 100.0 /100 | #4 | Exceptional $124,429 |
| Immigrants | India | 100.0 /100 | #5 | Exceptional $124,238 |
| Thais | 100.0 /100 | #6 | Exceptional $121,778 |
| Immigrants | Ireland | 100.0 /100 | #7 | Exceptional $120,333 |
| Iranians | 100.0 /100 | #8 | Exceptional $120,292 |
| Immigrants | China | 100.0 /100 | #9 | Exceptional $119,756 |
| Indians (Asian) | 100.0 /100 | #10 | Exceptional $119,496 |
| Okinawans | 100.0 /100 | #11 | Exceptional $119,349 |
| Immigrants | Iran | 100.0 /100 | #12 | Exceptional $119,204 |
| Immigrants | Eastern Asia | 100.0 /100 | #13 | Exceptional $118,056 |
| Immigrants | Israel | 100.0 /100 | #14 | Exceptional $117,219 |
| Immigrants | South Central Asia | 100.0 /100 | #15 | Exceptional $116,626 |
Demographics Similar to Sierra Leoneans by Householder Income Ages 25 - 44 years
In terms of householder income ages 25 - 44 years, the demographic groups most similar to Sierra Leoneans are Immigrants from Eritrea ($93,466, a difference of 0.030%), Spaniard ($93,366, a difference of 0.070%), German ($93,531, a difference of 0.10%), Guamanian/Chamorro ($93,569, a difference of 0.14%), and Uruguayan ($93,631, a difference of 0.21%).
| Demographics | Rating | Rank | Householder Income Ages 25 - 44 years |
| French Canadians | 38.2 /100 | #179 | Fair $93,694 |
| French | 37.8 /100 | #180 | Fair $93,665 |
| Puget Sound Salish | 37.7 /100 | #181 | Fair $93,661 |
| Uruguayans | 37.3 /100 | #182 | Fair $93,631 |
| Guamanians/Chamorros | 36.5 /100 | #183 | Fair $93,569 |
| Germans | 36.0 /100 | #184 | Fair $93,531 |
| Immigrants | Eritrea | 35.2 /100 | #185 | Fair $93,466 |
| Sierra Leoneans | 34.8 /100 | #186 | Fair $93,435 |
| Spaniards | 34.0 /100 | #187 | Fair $93,366 |
| Immigrants | Sierra Leone | 30.9 /100 | #188 | Fair $93,115 |
| Dutch | 30.5 /100 | #189 | Fair $93,081 |
| Welsh | 30.0 /100 | #190 | Fair $93,039 |
| Tlingit-Haida | 29.4 /100 | #191 | Fair $92,987 |
| Immigrants | Costa Rica | 28.2 /100 | #192 | Fair $92,876 |
| Samoans | 23.0 /100 | #193 | Fair $92,385 |