Immigrants from Iraq vs Immigrants from El Salvador Disability
COMPARE
Immigrants from Iraq
Immigrants from El Salvador
Disability
Disability Comparison
Immigrants from Iraq
Immigrants from El Salvador
12.0%
DISABILITY
7.1/ 100
METRIC RATING
213th/ 347
METRIC RANK
10.9%
DISABILITY
99.8/ 100
METRIC RATING
55th/ 347
METRIC RANK
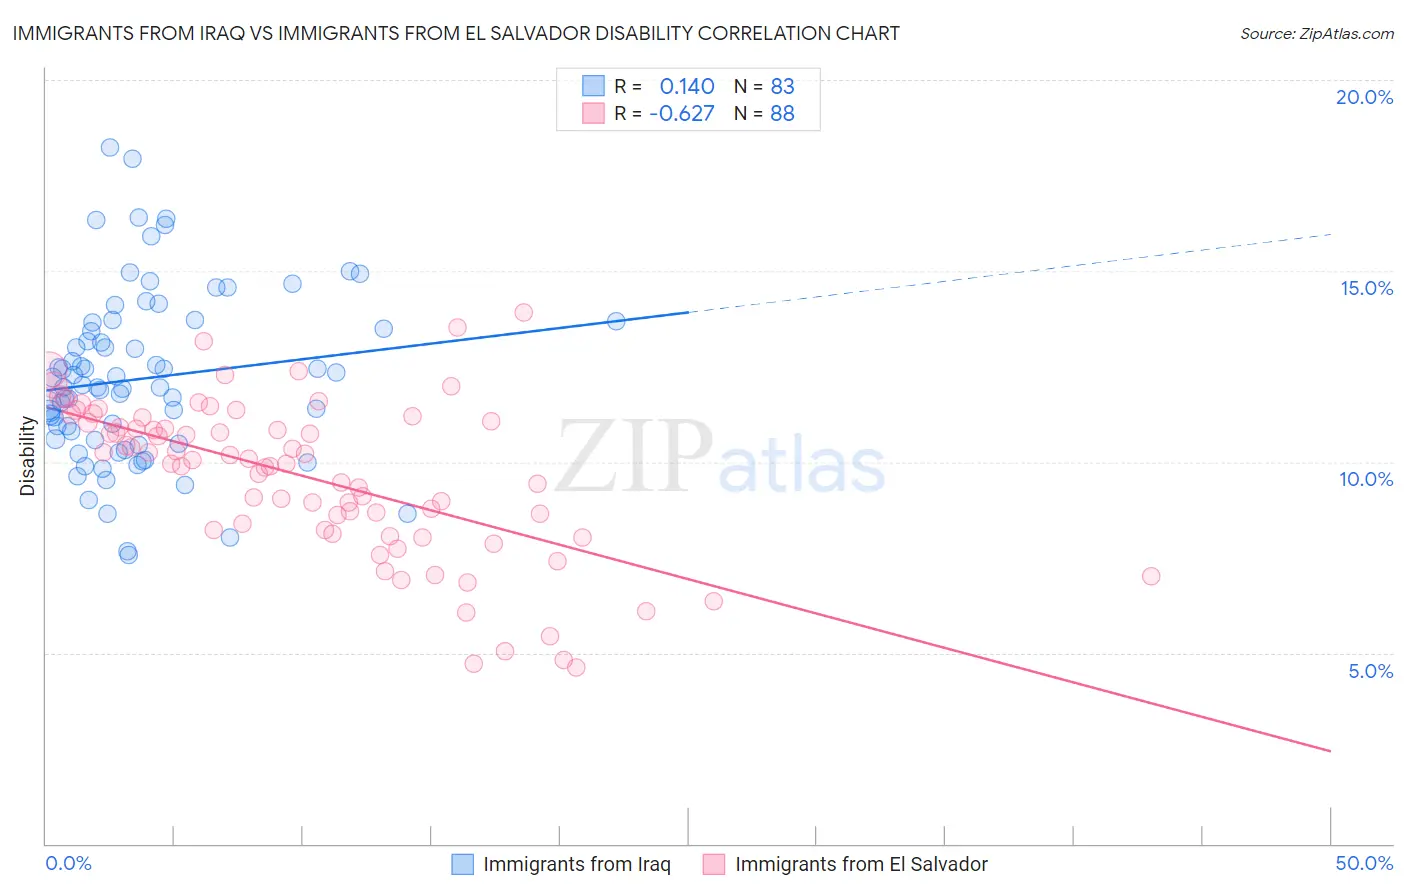
Immigrants from Iraq vs Immigrants from El Salvador Disability Correlation Chart
The statistical analysis conducted on geographies consisting of 194,773,815 people shows a poor positive correlation between the proportion of Immigrants from Iraq and percentage of population with a disability in the United States with a correlation coefficient (R) of 0.140 and weighted average of 12.0%. Similarly, the statistical analysis conducted on geographies consisting of 357,766,367 people shows a significant negative correlation between the proportion of Immigrants from El Salvador and percentage of population with a disability in the United States with a correlation coefficient (R) of -0.627 and weighted average of 10.9%, a difference of 10.6%.
Disability Correlation Summary
| Measurement | Immigrants from Iraq | Immigrants from El Salvador |
| Minimum | 7.6% | 4.6% |
| Maximum | 18.2% | 13.9% |
| Range | 10.7% | 9.3% |
| Mean | 12.2% | 9.6% |
| Median | 11.9% | 10.0% |
| Interquartile 25% (IQ1) | 10.6% | 8.2% |
| Interquartile 75% (IQ3) | 13.7% | 11.0% |
| Interquartile Range (IQR) | 3.1% | 2.8% |
| Standard Deviation (Sample) | 2.2% | 2.0% |
| Standard Deviation (Population) | 2.2% | 2.0% |
Similar Demographics by Disability
Demographics Similar to Immigrants from Iraq by Disability
In terms of disability, the demographic groups most similar to Immigrants from Iraq are Austrian (12.0%, a difference of 0.010%), Immigrants from Cambodia (12.0%, a difference of 0.030%), Immigrants from Somalia (12.0%, a difference of 0.050%), Czech (12.0%, a difference of 0.11%), and Immigrants from Canada (12.1%, a difference of 0.18%).
| Demographics | Rating | Rank | Disability |
| Immigrants | Senegal | 9.4 /100 | #206 | Tragic 12.0% |
| Immigrants | Thailand | 9.3 /100 | #207 | Tragic 12.0% |
| Immigrants | Caribbean | 9.1 /100 | #208 | Tragic 12.0% |
| Danes | 8.7 /100 | #209 | Tragic 12.0% |
| Czechs | 7.9 /100 | #210 | Tragic 12.0% |
| Immigrants | Cambodia | 7.3 /100 | #211 | Tragic 12.0% |
| Austrians | 7.2 /100 | #212 | Tragic 12.0% |
| Immigrants | Iraq | 7.1 /100 | #213 | Tragic 12.0% |
| Immigrants | Somalia | 6.8 /100 | #214 | Tragic 12.0% |
| Immigrants | Canada | 6.1 /100 | #215 | Tragic 12.1% |
| Panamanians | 5.4 /100 | #216 | Tragic 12.1% |
| Immigrants | North America | 5.3 /100 | #217 | Tragic 12.1% |
| Immigrants | Jamaica | 5.0 /100 | #218 | Tragic 12.1% |
| Croatians | 4.9 /100 | #219 | Tragic 12.1% |
| Immigrants | Bahamas | 4.7 /100 | #220 | Tragic 12.1% |
Demographics Similar to Immigrants from El Salvador by Disability
In terms of disability, the demographic groups most similar to Immigrants from El Salvador are Immigrants from Spain (10.9%, a difference of 0.090%), Jordanian (10.9%, a difference of 0.090%), South American (10.9%, a difference of 0.11%), Immigrants from Lithuania (10.9%, a difference of 0.11%), and Peruvian (10.9%, a difference of 0.16%).
| Demographics | Rating | Rank | Disability |
| Soviet Union | 99.9 /100 | #48 | Exceptional 10.9% |
| Vietnamese | 99.9 /100 | #49 | Exceptional 10.9% |
| Immigrants | Saudi Arabia | 99.9 /100 | #50 | Exceptional 10.9% |
| Peruvians | 99.8 /100 | #51 | Exceptional 10.9% |
| South Americans | 99.8 /100 | #52 | Exceptional 10.9% |
| Immigrants | Spain | 99.8 /100 | #53 | Exceptional 10.9% |
| Jordanians | 99.8 /100 | #54 | Exceptional 10.9% |
| Immigrants | El Salvador | 99.8 /100 | #55 | Exceptional 10.9% |
| Immigrants | Lithuania | 99.8 /100 | #56 | Exceptional 10.9% |
| Salvadorans | 99.8 /100 | #57 | Exceptional 10.9% |
| Immigrants | South America | 99.8 /100 | #58 | Exceptional 10.9% |
| Immigrants | Colombia | 99.7 /100 | #59 | Exceptional 10.9% |
| Zimbabweans | 99.7 /100 | #60 | Exceptional 10.9% |
| Immigrants | Bulgaria | 99.7 /100 | #61 | Exceptional 10.9% |
| Immigrants | Northern Africa | 99.7 /100 | #62 | Exceptional 10.9% |