Immigrants from Iraq vs Immigrants from El Salvador Unemployment Among Ages 60 to 64 years
COMPARE
Immigrants from Iraq
Immigrants from El Salvador
Unemployment Among Ages 60 to 64 years
Unemployment Among Ages 60 to 64 years Comparison
Immigrants from Iraq
Immigrants from El Salvador
4.5%
UNEMPLOYMENT AMONG AGES 60 TO 64 YEARS
100.0/ 100
METRIC RATING
27th/ 347
METRIC RANK
5.4%
UNEMPLOYMENT AMONG AGES 60 TO 64 YEARS
0.0/ 100
METRIC RATING
299th/ 347
METRIC RANK
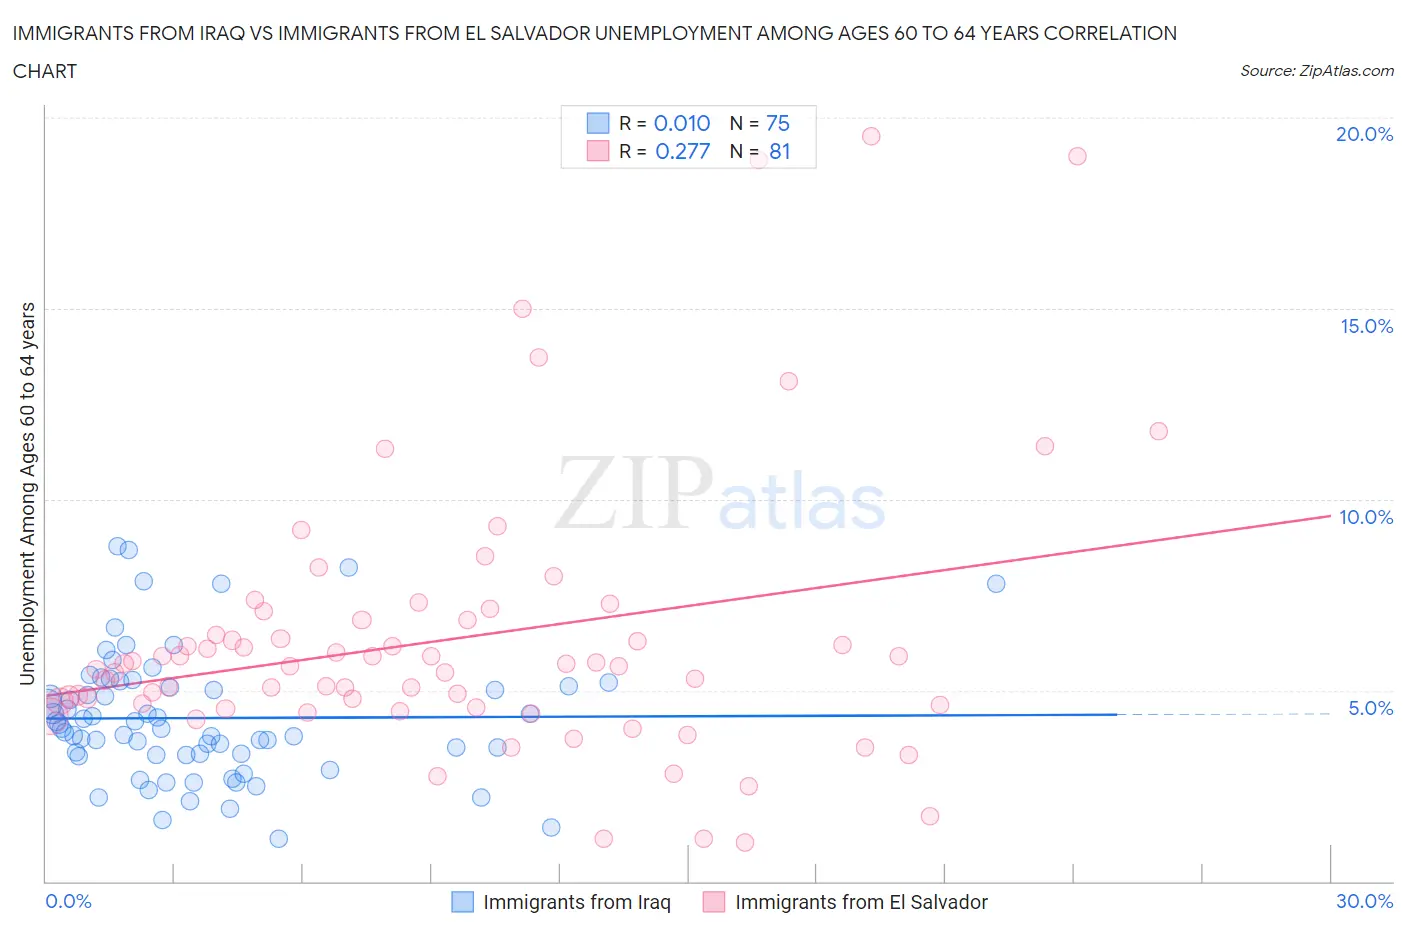
Immigrants from Iraq vs Immigrants from El Salvador Unemployment Among Ages 60 to 64 years Correlation Chart
The statistical analysis conducted on geographies consisting of 186,153,445 people shows no correlation between the proportion of Immigrants from Iraq and unemployment rate among population between the ages 60 and 64 in the United States with a correlation coefficient (R) of 0.010 and weighted average of 4.5%. Similarly, the statistical analysis conducted on geographies consisting of 328,799,100 people shows a weak positive correlation between the proportion of Immigrants from El Salvador and unemployment rate among population between the ages 60 and 64 in the United States with a correlation coefficient (R) of 0.277 and weighted average of 5.4%, a difference of 20.4%.
Unemployment Among Ages 60 to 64 years Correlation Summary
| Measurement | Immigrants from Iraq | Immigrants from El Salvador |
| Minimum | 1.1% | 1.0% |
| Maximum | 8.8% | 19.5% |
| Range | 7.7% | 18.5% |
| Mean | 4.3% | 6.3% |
| Median | 4.0% | 5.6% |
| Interquartile 25% (IQ1) | 3.3% | 4.6% |
| Interquartile 75% (IQ3) | 5.1% | 6.8% |
| Interquartile Range (IQR) | 1.8% | 2.3% |
| Standard Deviation (Sample) | 1.7% | 3.6% |
| Standard Deviation (Population) | 1.6% | 3.6% |
Similar Demographics by Unemployment Among Ages 60 to 64 years
Demographics Similar to Immigrants from Iraq by Unemployment Among Ages 60 to 64 years
In terms of unemployment among ages 60 to 64 years, the demographic groups most similar to Immigrants from Iraq are Immigrants from Nepal (4.5%, a difference of 0.070%), Czech (4.4%, a difference of 0.080%), Yugoslavian (4.4%, a difference of 0.18%), Cuban (4.5%, a difference of 0.31%), and Immigrants from Venezuela (4.5%, a difference of 0.33%).
| Demographics | Rating | Rank | Unemployment Among Ages 60 to 64 years |
| Afghans | 100.0 /100 | #20 | Exceptional 4.4% |
| Immigrants | Cabo Verde | 100.0 /100 | #21 | Exceptional 4.4% |
| Cape Verdeans | 100.0 /100 | #22 | Exceptional 4.4% |
| Immigrants | Zaire | 100.0 /100 | #23 | Exceptional 4.4% |
| Immigrants | Burma/Myanmar | 100.0 /100 | #24 | Exceptional 4.4% |
| Yugoslavians | 100.0 /100 | #25 | Exceptional 4.4% |
| Czechs | 100.0 /100 | #26 | Exceptional 4.4% |
| Immigrants | Iraq | 100.0 /100 | #27 | Exceptional 4.5% |
| Immigrants | Nepal | 100.0 /100 | #28 | Exceptional 4.5% |
| Cubans | 100.0 /100 | #29 | Exceptional 4.5% |
| Immigrants | Venezuela | 100.0 /100 | #30 | Exceptional 4.5% |
| Immigrants | Eritrea | 100.0 /100 | #31 | Exceptional 4.5% |
| Zimbabweans | 100.0 /100 | #32 | Exceptional 4.5% |
| Carpatho Rusyns | 100.0 /100 | #33 | Exceptional 4.5% |
| Belgians | 100.0 /100 | #34 | Exceptional 4.5% |
Demographics Similar to Immigrants from El Salvador by Unemployment Among Ages 60 to 64 years
In terms of unemployment among ages 60 to 64 years, the demographic groups most similar to Immigrants from El Salvador are Immigrants from Barbados (5.4%, a difference of 0.030%), Immigrants from Central America (5.4%, a difference of 0.050%), Immigrants from Jamaica (5.4%, a difference of 0.050%), Osage (5.4%, a difference of 0.10%), and Barbadian (5.4%, a difference of 0.45%).
| Demographics | Rating | Rank | Unemployment Among Ages 60 to 64 years |
| Immigrants | Latin America | 0.0 /100 | #292 | Tragic 5.3% |
| Immigrants | Israel | 0.0 /100 | #293 | Tragic 5.3% |
| Blacks/African Americans | 0.0 /100 | #294 | Tragic 5.3% |
| Armenians | 0.0 /100 | #295 | Tragic 5.3% |
| Jamaicans | 0.0 /100 | #296 | Tragic 5.3% |
| Osage | 0.0 /100 | #297 | Tragic 5.4% |
| Immigrants | Central America | 0.0 /100 | #298 | Tragic 5.4% |
| Immigrants | El Salvador | 0.0 /100 | #299 | Tragic 5.4% |
| Immigrants | Barbados | 0.0 /100 | #300 | Tragic 5.4% |
| Immigrants | Jamaica | 0.0 /100 | #301 | Tragic 5.4% |
| Barbadians | 0.0 /100 | #302 | Tragic 5.4% |
| Bahamians | 0.0 /100 | #303 | Tragic 5.4% |
| Immigrants | Mexico | 0.0 /100 | #304 | Tragic 5.4% |
| Cypriots | 0.0 /100 | #305 | Tragic 5.4% |
| Immigrants | Dominica | 0.0 /100 | #306 | Tragic 5.4% |