Immigrants from Iraq vs Colombian Disability Age 35 to 64
COMPARE
Immigrants from Iraq
Colombian
Disability Age 35 to 64
Disability Age 35 to 64 Comparison
Immigrants from Iraq
Colombians
11.6%
DISABILITY AGE 35 TO 64
21.0/ 100
METRIC RATING
197th/ 347
METRIC RANK
9.9%
DISABILITY AGE 35 TO 64
99.8/ 100
METRIC RATING
57th/ 347
METRIC RANK
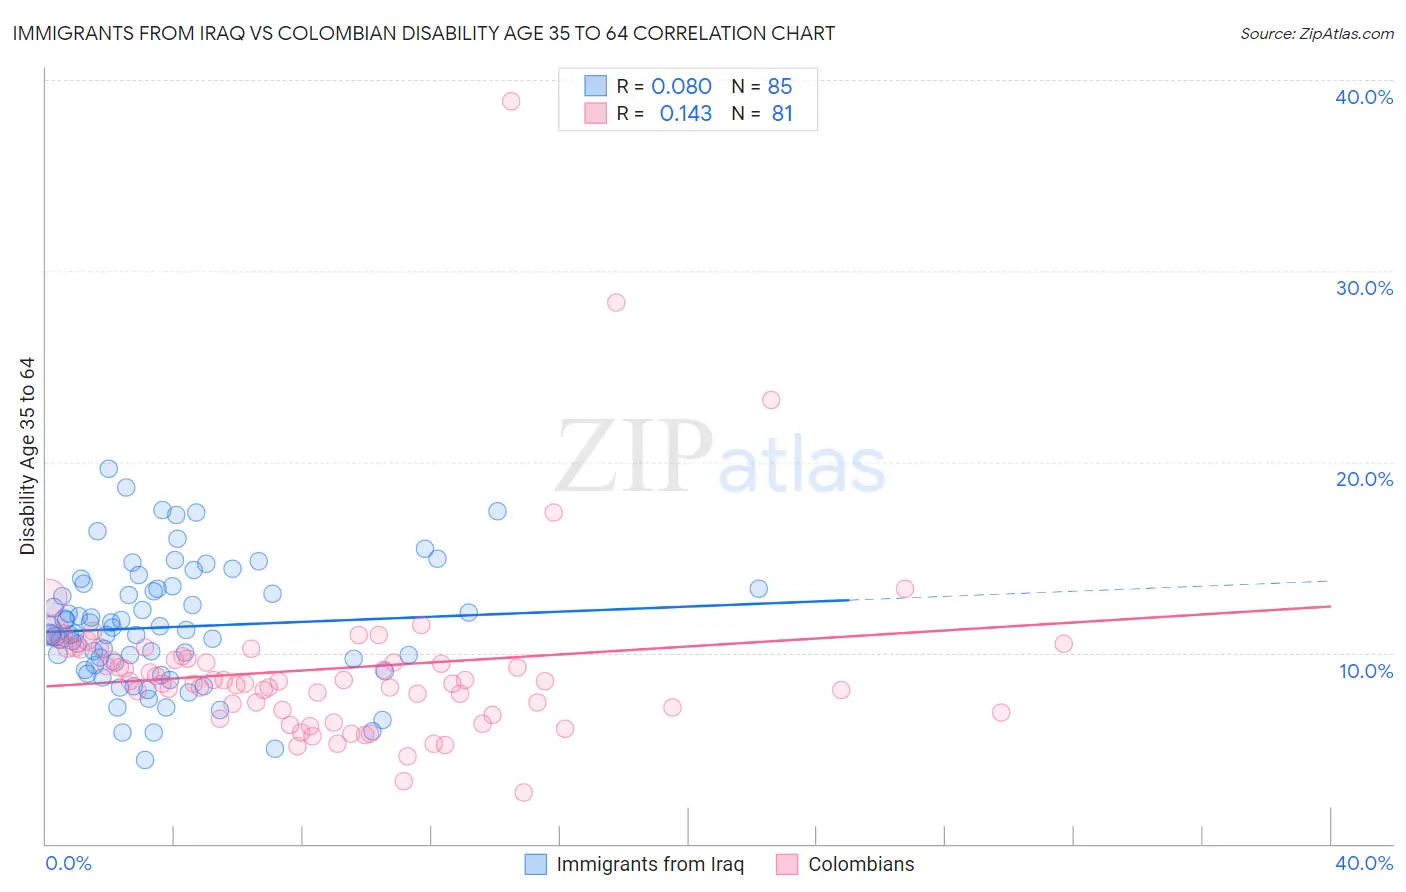
Immigrants from Iraq vs Colombian Disability Age 35 to 64 Correlation Chart
The statistical analysis conducted on geographies consisting of 194,750,535 people shows a slight positive correlation between the proportion of Immigrants from Iraq and percentage of population with a disability between the ages 34 and 64 in the United States with a correlation coefficient (R) of 0.080 and weighted average of 11.6%. Similarly, the statistical analysis conducted on geographies consisting of 419,251,936 people shows a poor positive correlation between the proportion of Colombians and percentage of population with a disability between the ages 34 and 64 in the United States with a correlation coefficient (R) of 0.143 and weighted average of 9.9%, a difference of 17.1%.
Disability Age 35 to 64 Correlation Summary
| Measurement | Immigrants from Iraq | Colombian |
| Minimum | 4.4% | 2.7% |
| Maximum | 19.6% | 38.9% |
| Range | 15.3% | 36.2% |
| Mean | 11.3% | 9.2% |
| Median | 11.0% | 8.5% |
| Interquartile 25% (IQ1) | 9.2% | 6.9% |
| Interquartile 75% (IQ3) | 13.4% | 10.0% |
| Interquartile Range (IQR) | 4.1% | 3.1% |
| Standard Deviation (Sample) | 3.2% | 4.9% |
| Standard Deviation (Population) | 3.2% | 4.8% |
Similar Demographics by Disability Age 35 to 64
Demographics Similar to Immigrants from Iraq by Disability Age 35 to 64
In terms of disability age 35 to 64, the demographic groups most similar to Immigrants from Iraq are Immigrants from Panama (11.6%, a difference of 0.080%), Basque (11.6%, a difference of 0.19%), Swiss (11.6%, a difference of 0.29%), Iraqi (11.5%, a difference of 0.36%), and Immigrants from Kenya (11.6%, a difference of 0.42%).
| Demographics | Rating | Rank | Disability Age 35 to 64 |
| Immigrants | Nigeria | 32.5 /100 | #190 | Fair 11.4% |
| Swedes | 31.3 /100 | #191 | Fair 11.4% |
| Norwegians | 29.7 /100 | #192 | Fair 11.5% |
| Immigrants | Africa | 29.0 /100 | #193 | Fair 11.5% |
| Immigrants | Latin America | 27.5 /100 | #194 | Fair 11.5% |
| Carpatho Rusyns | 25.3 /100 | #195 | Fair 11.5% |
| Iraqis | 24.2 /100 | #196 | Fair 11.5% |
| Immigrants | Iraq | 21.0 /100 | #197 | Fair 11.6% |
| Immigrants | Panama | 20.4 /100 | #198 | Fair 11.6% |
| Basques | 19.5 /100 | #199 | Poor 11.6% |
| Swiss | 18.7 /100 | #200 | Poor 11.6% |
| Immigrants | Kenya | 17.7 /100 | #201 | Poor 11.6% |
| Immigrants | Guatemala | 17.5 /100 | #202 | Poor 11.6% |
| British | 17.0 /100 | #203 | Poor 11.6% |
| Nigerians | 16.3 /100 | #204 | Poor 11.6% |
Demographics Similar to Colombians by Disability Age 35 to 64
In terms of disability age 35 to 64, the demographic groups most similar to Colombians are South American (9.9%, a difference of 0.010%), Armenian (9.9%, a difference of 0.10%), Peruvian (9.9%, a difference of 0.24%), Immigrants from Russia (9.8%, a difference of 0.30%), and Taiwanese (9.8%, a difference of 0.34%).
| Demographics | Rating | Rank | Disability Age 35 to 64 |
| Paraguayans | 99.8 /100 | #50 | Exceptional 9.8% |
| Bhutanese | 99.8 /100 | #51 | Exceptional 9.8% |
| Immigrants | Bulgaria | 99.8 /100 | #52 | Exceptional 9.8% |
| Taiwanese | 99.8 /100 | #53 | Exceptional 9.8% |
| Immigrants | Russia | 99.8 /100 | #54 | Exceptional 9.8% |
| Peruvians | 99.8 /100 | #55 | Exceptional 9.9% |
| South Americans | 99.8 /100 | #56 | Exceptional 9.9% |
| Colombians | 99.8 /100 | #57 | Exceptional 9.9% |
| Armenians | 99.8 /100 | #58 | Exceptional 9.9% |
| Immigrants | Sweden | 99.7 /100 | #59 | Exceptional 9.9% |
| Immigrants | South America | 99.7 /100 | #60 | Exceptional 9.9% |
| Immigrants | Spain | 99.7 /100 | #61 | Exceptional 10.0% |
| Eastern Europeans | 99.7 /100 | #62 | Exceptional 10.0% |
| Immigrants | Czechoslovakia | 99.7 /100 | #63 | Exceptional 10.0% |
| Immigrants | Romania | 99.7 /100 | #64 | Exceptional 10.0% |