Immigrants from Indonesia vs Assyrian/Chaldean/Syriac Householder Income Ages 45 - 64 years
COMPARE
Immigrants from Indonesia
Assyrian/Chaldean/Syriac
Householder Income Ages 45 - 64 years
Householder Income Ages 45 - 64 years Comparison
Immigrants from Indonesia
Assyrians/Chaldeans/Syriacs
$113,519
HOUSEHOLDER INCOME AGES 45 - 64 YEARS
99.9/ 100
METRIC RATING
48th/ 347
METRIC RANK
$110,201
HOUSEHOLDER INCOME AGES 45 - 64 YEARS
99.3/ 100
METRIC RATING
72nd/ 347
METRIC RANK
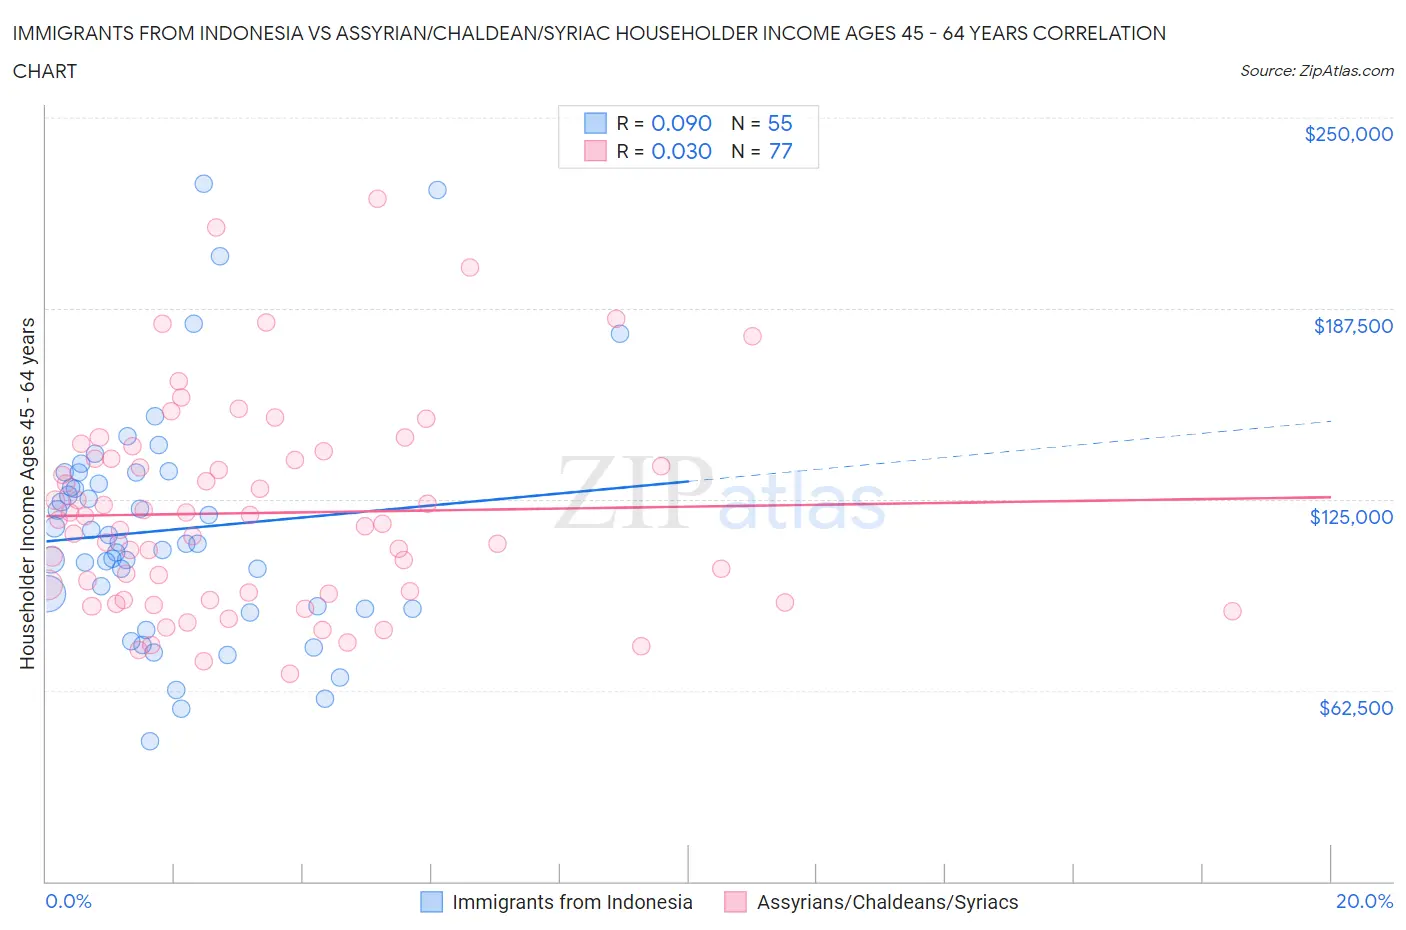
Immigrants from Indonesia vs Assyrian/Chaldean/Syriac Householder Income Ages 45 - 64 years Correlation Chart
The statistical analysis conducted on geographies consisting of 215,592,111 people shows a slight positive correlation between the proportion of Immigrants from Indonesia and household income with householder between the ages 45 and 64 in the United States with a correlation coefficient (R) of 0.090 and weighted average of $113,519. Similarly, the statistical analysis conducted on geographies consisting of 110,244,252 people shows no correlation between the proportion of Assyrians/Chaldeans/Syriacs and household income with householder between the ages 45 and 64 in the United States with a correlation coefficient (R) of 0.030 and weighted average of $110,201, a difference of 3.0%.
Householder Income Ages 45 - 64 years Correlation Summary
| Measurement | Immigrants from Indonesia | Assyrian/Chaldean/Syriac |
| Minimum | $45,964 | $67,992 |
| Maximum | $228,214 | $223,409 |
| Range | $182,250 | $155,417 |
| Mean | $114,986 | $120,547 |
| Median | $110,532 | $117,054 |
| Interquartile 25% (IQ1) | $89,063 | $93,085 |
| Interquartile 75% (IQ3) | $133,651 | $138,155 |
| Interquartile Range (IQR) | $44,588 | $45,070 |
| Standard Deviation (Sample) | $37,980 | $33,489 |
| Standard Deviation (Population) | $37,633 | $33,271 |
Similar Demographics by Householder Income Ages 45 - 64 years
Demographics Similar to Immigrants from Indonesia by Householder Income Ages 45 - 64 years
In terms of householder income ages 45 - 64 years, the demographic groups most similar to Immigrants from Indonesia are Australian ($113,533, a difference of 0.010%), Immigrants from Greece ($113,548, a difference of 0.030%), Immigrants from France ($113,680, a difference of 0.14%), Immigrants from Russia ($113,215, a difference of 0.27%), and Bulgarian ($113,883, a difference of 0.32%).
| Demographics | Rating | Rank | Householder Income Ages 45 - 64 years |
| Immigrants | Lithuania | 99.9 /100 | #41 | Exceptional $114,336 |
| Estonians | 99.9 /100 | #42 | Exceptional $114,220 |
| Israelis | 99.9 /100 | #43 | Exceptional $114,186 |
| Bulgarians | 99.9 /100 | #44 | Exceptional $113,883 |
| Immigrants | France | 99.9 /100 | #45 | Exceptional $113,680 |
| Immigrants | Greece | 99.9 /100 | #46 | Exceptional $113,548 |
| Australians | 99.9 /100 | #47 | Exceptional $113,533 |
| Immigrants | Indonesia | 99.9 /100 | #48 | Exceptional $113,519 |
| Immigrants | Russia | 99.8 /100 | #49 | Exceptional $113,215 |
| Immigrants | Austria | 99.8 /100 | #50 | Exceptional $113,140 |
| Immigrants | South Africa | 99.8 /100 | #51 | Exceptional $112,886 |
| Immigrants | Malaysia | 99.8 /100 | #52 | Exceptional $112,796 |
| Afghans | 99.8 /100 | #53 | Exceptional $112,676 |
| Greeks | 99.8 /100 | #54 | Exceptional $112,630 |
| Lithuanians | 99.8 /100 | #55 | Exceptional $112,484 |
Demographics Similar to Assyrians/Chaldeans/Syriacs by Householder Income Ages 45 - 64 years
In terms of householder income ages 45 - 64 years, the demographic groups most similar to Assyrians/Chaldeans/Syriacs are Italian ($110,224, a difference of 0.020%), Argentinean ($110,103, a difference of 0.090%), Korean ($110,334, a difference of 0.12%), Immigrants from Italy ($110,434, a difference of 0.21%), and Immigrants from Egypt ($109,941, a difference of 0.24%).
| Demographics | Rating | Rank | Householder Income Ages 45 - 64 years |
| Immigrants | Belarus | 99.6 /100 | #65 | Exceptional $111,430 |
| New Zealanders | 99.6 /100 | #66 | Exceptional $111,286 |
| Laotians | 99.5 /100 | #67 | Exceptional $111,051 |
| Immigrants | Romania | 99.4 /100 | #68 | Exceptional $110,633 |
| Immigrants | Italy | 99.4 /100 | #69 | Exceptional $110,434 |
| Koreans | 99.3 /100 | #70 | Exceptional $110,334 |
| Italians | 99.3 /100 | #71 | Exceptional $110,224 |
| Assyrians/Chaldeans/Syriacs | 99.3 /100 | #72 | Exceptional $110,201 |
| Argentineans | 99.3 /100 | #73 | Exceptional $110,103 |
| Immigrants | Egypt | 99.2 /100 | #74 | Exceptional $109,941 |
| South Africans | 99.1 /100 | #75 | Exceptional $109,719 |
| Paraguayans | 99.0 /100 | #76 | Exceptional $109,447 |
| Immigrants | England | 99.0 /100 | #77 | Exceptional $109,446 |
| Immigrants | Canada | 99.0 /100 | #78 | Exceptional $109,402 |
| Immigrants | Bulgaria | 98.9 /100 | #79 | Exceptional $109,379 |