Immigrants from Indonesia vs Immigrants from Eastern Europe 5th Grade
COMPARE
Immigrants from Indonesia
Immigrants from Eastern Europe
5th Grade
5th Grade Comparison
Immigrants from Indonesia
Immigrants from Eastern Europe
96.9%
5TH GRADE
2.0/ 100
METRIC RATING
237th/ 347
METRIC RANK
97.4%
5TH GRADE
75.0/ 100
METRIC RATING
151st/ 347
METRIC RANK
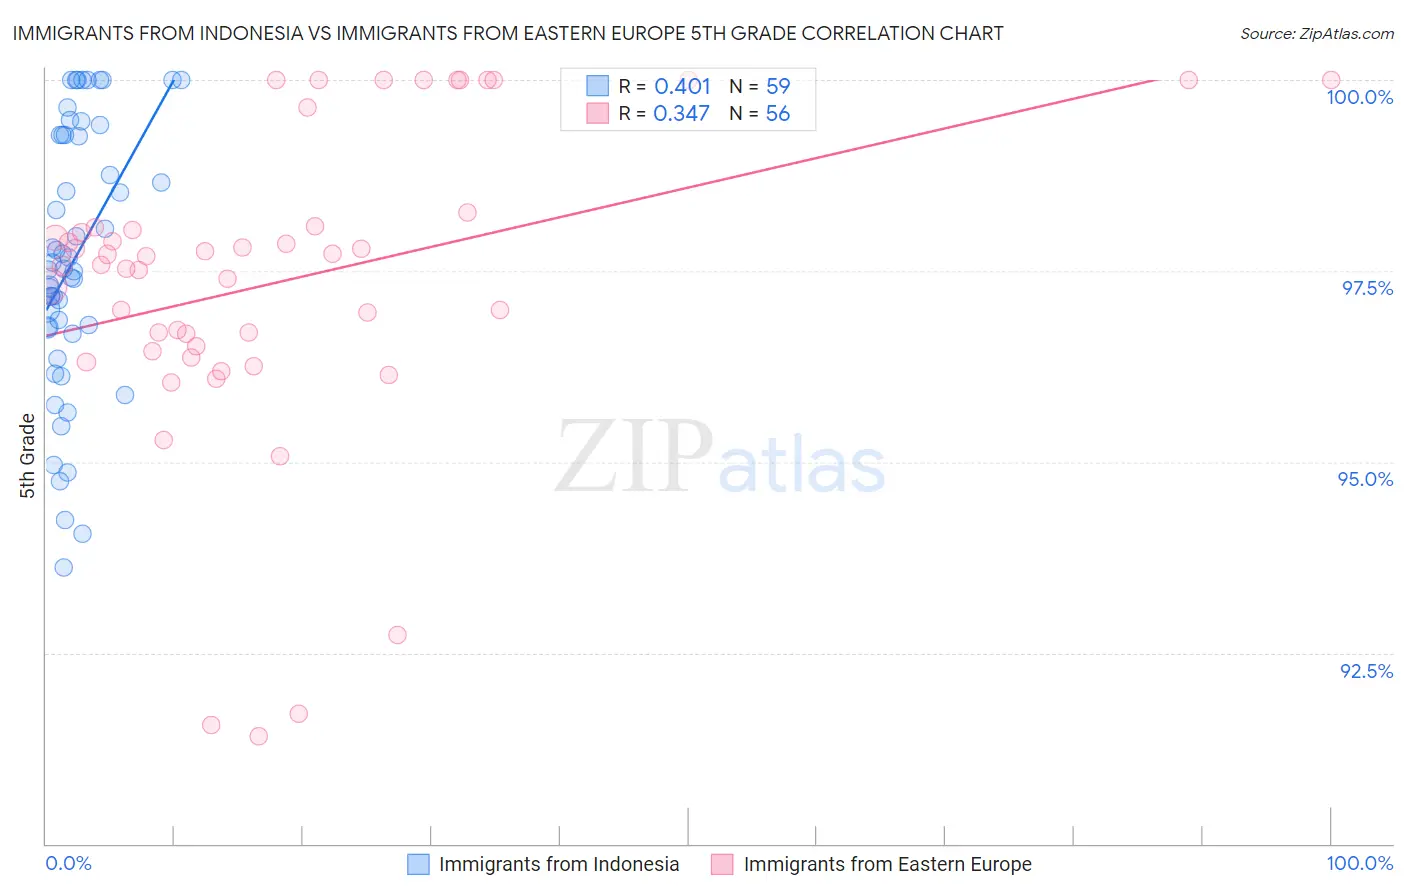
Immigrants from Indonesia vs Immigrants from Eastern Europe 5th Grade Correlation Chart
The statistical analysis conducted on geographies consisting of 215,782,971 people shows a moderate positive correlation between the proportion of Immigrants from Indonesia and percentage of population with at least 5th grade education in the United States with a correlation coefficient (R) of 0.401 and weighted average of 96.9%. Similarly, the statistical analysis conducted on geographies consisting of 475,879,420 people shows a mild positive correlation between the proportion of Immigrants from Eastern Europe and percentage of population with at least 5th grade education in the United States with a correlation coefficient (R) of 0.347 and weighted average of 97.4%, a difference of 0.52%.
5th Grade Correlation Summary
| Measurement | Immigrants from Indonesia | Immigrants from Eastern Europe |
| Minimum | 93.6% | 91.4% |
| Maximum | 100.0% | 100.0% |
| Range | 6.4% | 8.6% |
| Mean | 97.7% | 97.4% |
| Median | 97.5% | 97.6% |
| Interquartile 25% (IQ1) | 96.8% | 96.5% |
| Interquartile 75% (IQ3) | 99.3% | 98.1% |
| Interquartile Range (IQR) | 2.5% | 1.6% |
| Standard Deviation (Sample) | 1.7% | 2.1% |
| Standard Deviation (Population) | 1.7% | 2.0% |
Similar Demographics by 5th Grade
Demographics Similar to Immigrants from Indonesia by 5th Grade
In terms of 5th grade, the demographic groups most similar to Immigrants from Indonesia are Asian (96.9%, a difference of 0.0%), Nigerian (96.9%, a difference of 0.010%), Indian (Asian) (96.9%, a difference of 0.010%), Immigrants from Asia (96.9%, a difference of 0.020%), and Immigrants from Costa Rica (96.9%, a difference of 0.020%).
| Demographics | Rating | Rank | 5th Grade |
| Immigrants | Western Asia | 4.3 /100 | #230 | Tragic 97.0% |
| Immigrants | Malaysia | 4.1 /100 | #231 | Tragic 97.0% |
| Immigrants | Eastern Asia | 4.0 /100 | #232 | Tragic 97.0% |
| Sub-Saharan Africans | 3.3 /100 | #233 | Tragic 97.0% |
| Tohono O'odham | 3.2 /100 | #234 | Tragic 97.0% |
| Uruguayans | 3.2 /100 | #235 | Tragic 97.0% |
| Senegalese | 2.8 /100 | #236 | Tragic 97.0% |
| Immigrants | Indonesia | 2.0 /100 | #237 | Tragic 96.9% |
| Asians | 2.0 /100 | #238 | Tragic 96.9% |
| Nigerians | 1.9 /100 | #239 | Tragic 96.9% |
| Indians (Asian) | 1.9 /100 | #240 | Tragic 96.9% |
| Immigrants | Asia | 1.7 /100 | #241 | Tragic 96.9% |
| Immigrants | Costa Rica | 1.6 /100 | #242 | Tragic 96.9% |
| Immigrants | Eastern Africa | 1.6 /100 | #243 | Tragic 96.9% |
| Koreans | 1.6 /100 | #244 | Tragic 96.9% |
Demographics Similar to Immigrants from Eastern Europe by 5th Grade
In terms of 5th grade, the demographic groups most similar to Immigrants from Eastern Europe are Ute (97.4%, a difference of 0.0%), Alsatian (97.4%, a difference of 0.0%), Immigrants from Israel (97.5%, a difference of 0.020%), Hopi (97.5%, a difference of 0.020%), and Immigrants from South Central Asia (97.5%, a difference of 0.020%).
| Demographics | Rating | Rank | 5th Grade |
| Immigrants | Greece | 83.2 /100 | #144 | Excellent 97.5% |
| Jordanians | 82.6 /100 | #145 | Excellent 97.5% |
| Spaniards | 81.9 /100 | #146 | Excellent 97.5% |
| Soviet Union | 81.2 /100 | #147 | Excellent 97.5% |
| Immigrants | Israel | 79.1 /100 | #148 | Good 97.5% |
| Hopi | 78.6 /100 | #149 | Good 97.5% |
| Immigrants | South Central Asia | 78.6 /100 | #150 | Good 97.5% |
| Immigrants | Eastern Europe | 75.0 /100 | #151 | Good 97.4% |
| Ute | 74.9 /100 | #152 | Good 97.4% |
| Alsatians | 74.3 /100 | #153 | Good 97.4% |
| Immigrants | Russia | 71.2 /100 | #154 | Good 97.4% |
| Immigrants | Bosnia and Herzegovina | 71.0 /100 | #155 | Good 97.4% |
| French American Indians | 70.5 /100 | #156 | Good 97.4% |
| Immigrants | Jordan | 70.4 /100 | #157 | Good 97.4% |
| Albanians | 68.3 /100 | #158 | Good 97.4% |