Immigrants from Indonesia vs Carpatho Rusyn 2nd Grade
COMPARE
Immigrants from Indonesia
Carpatho Rusyn
2nd Grade
2nd Grade Comparison
Immigrants from Indonesia
Carpatho Rusyns
97.5%
2ND GRADE
1.2/ 100
METRIC RATING
242nd/ 347
METRIC RANK
98.6%
2ND GRADE
100.0/ 100
METRIC RATING
12th/ 347
METRIC RANK
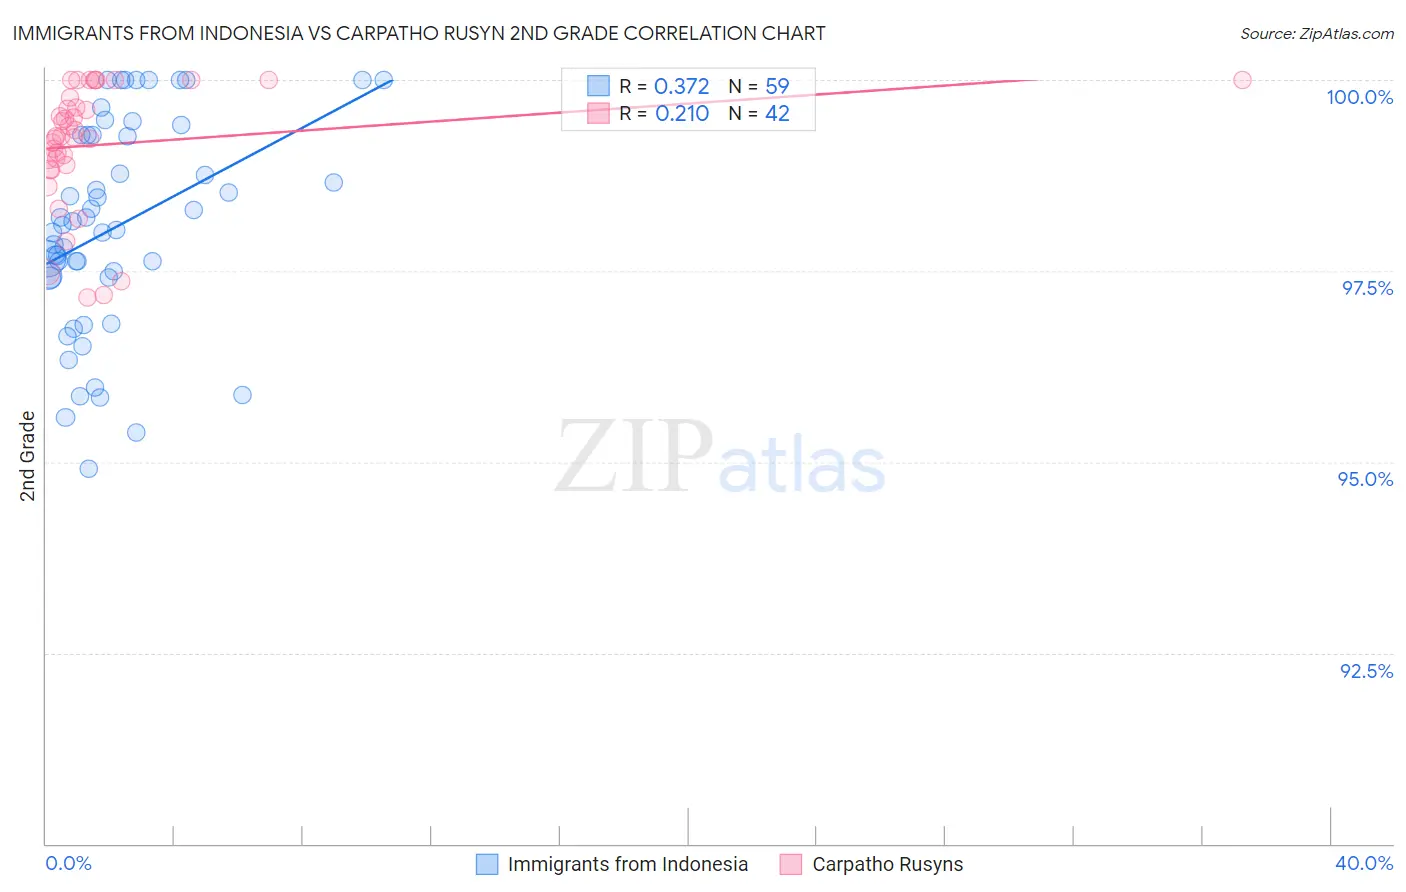
Immigrants from Indonesia vs Carpatho Rusyn 2nd Grade Correlation Chart
The statistical analysis conducted on geographies consisting of 215,782,971 people shows a mild positive correlation between the proportion of Immigrants from Indonesia and percentage of population with at least 2nd grade education in the United States with a correlation coefficient (R) of 0.372 and weighted average of 97.5%. Similarly, the statistical analysis conducted on geographies consisting of 58,871,690 people shows a weak positive correlation between the proportion of Carpatho Rusyns and percentage of population with at least 2nd grade education in the United States with a correlation coefficient (R) of 0.210 and weighted average of 98.6%, a difference of 1.1%.
2nd Grade Correlation Summary
| Measurement | Immigrants from Indonesia | Carpatho Rusyn |
| Minimum | 94.9% | 97.2% |
| Maximum | 100.0% | 100.0% |
| Range | 5.1% | 2.8% |
| Mean | 98.1% | 99.2% |
| Median | 98.1% | 99.3% |
| Interquartile 25% (IQ1) | 97.4% | 98.9% |
| Interquartile 75% (IQ3) | 99.3% | 99.8% |
| Interquartile Range (IQR) | 1.9% | 0.88% |
| Standard Deviation (Sample) | 1.4% | 0.81% |
| Standard Deviation (Population) | 1.3% | 0.80% |
Similar Demographics by 2nd Grade
Demographics Similar to Immigrants from Indonesia by 2nd Grade
In terms of 2nd grade, the demographic groups most similar to Immigrants from Indonesia are Ethiopian (97.5%, a difference of 0.0%), Korean (97.5%, a difference of 0.010%), Asian (97.5%, a difference of 0.010%), Nigerian (97.6%, a difference of 0.020%), and U.S. Virgin Islander (97.6%, a difference of 0.020%).
| Demographics | Rating | Rank | 2nd Grade |
| Colombians | 1.9 /100 | #235 | Tragic 97.6% |
| Nigerians | 1.7 /100 | #236 | Tragic 97.6% |
| U.S. Virgin Islanders | 1.6 /100 | #237 | Tragic 97.6% |
| Immigrants | Eastern Asia | 1.6 /100 | #238 | Tragic 97.6% |
| Liberians | 1.6 /100 | #239 | Tragic 97.6% |
| Koreans | 1.5 /100 | #240 | Tragic 97.5% |
| Ethiopians | 1.2 /100 | #241 | Tragic 97.5% |
| Immigrants | Indonesia | 1.2 /100 | #242 | Tragic 97.5% |
| Asians | 1.1 /100 | #243 | Tragic 97.5% |
| Immigrants | Iraq | 1.0 /100 | #244 | Tragic 97.5% |
| Immigrants | Eastern Africa | 0.9 /100 | #245 | Tragic 97.5% |
| South Americans | 0.9 /100 | #246 | Tragic 97.5% |
| Immigrants | Senegal | 0.9 /100 | #247 | Tragic 97.5% |
| Immigrants | Middle Africa | 0.9 /100 | #248 | Tragic 97.5% |
| Bolivians | 0.9 /100 | #249 | Tragic 97.5% |
Demographics Similar to Carpatho Rusyns by 2nd Grade
In terms of 2nd grade, the demographic groups most similar to Carpatho Rusyns are English (98.6%, a difference of 0.0%), Slovene (98.6%, a difference of 0.010%), Tlingit-Haida (98.6%, a difference of 0.010%), Swedish (98.6%, a difference of 0.020%), and Scottish (98.6%, a difference of 0.030%).
| Demographics | Rating | Rank | 2nd Grade |
| Alaskan Athabascans | 100.0 /100 | #5 | Exceptional 98.7% |
| Alaska Natives | 100.0 /100 | #6 | Exceptional 98.7% |
| Norwegians | 100.0 /100 | #7 | Exceptional 98.7% |
| Germans | 100.0 /100 | #8 | Exceptional 98.7% |
| Slovaks | 100.0 /100 | #9 | Exceptional 98.7% |
| Slovenes | 100.0 /100 | #10 | Exceptional 98.6% |
| Tlingit-Haida | 100.0 /100 | #11 | Exceptional 98.6% |
| Carpatho Rusyns | 100.0 /100 | #12 | Exceptional 98.6% |
| English | 100.0 /100 | #13 | Exceptional 98.6% |
| Swedes | 100.0 /100 | #14 | Exceptional 98.6% |
| Scottish | 100.0 /100 | #15 | Exceptional 98.6% |
| Dutch | 100.0 /100 | #16 | Exceptional 98.6% |
| Aleuts | 100.0 /100 | #17 | Exceptional 98.6% |
| Irish | 100.0 /100 | #18 | Exceptional 98.6% |
| Finns | 100.0 /100 | #19 | Exceptional 98.5% |