Immigrants from Honduras vs Native/Alaskan Householder Income Under 25 years
COMPARE
Immigrants from Honduras
Native/Alaskan
Householder Income Under 25 years
Householder Income Under 25 years Comparison
Immigrants from Honduras
Natives/Alaskans
$48,267
HOUSEHOLDER INCOME UNDER 25 YEARS
0.0/ 100
METRIC RATING
299th/ 347
METRIC RANK
$47,704
HOUSEHOLDER INCOME UNDER 25 YEARS
0.0/ 100
METRIC RATING
306th/ 347
METRIC RANK
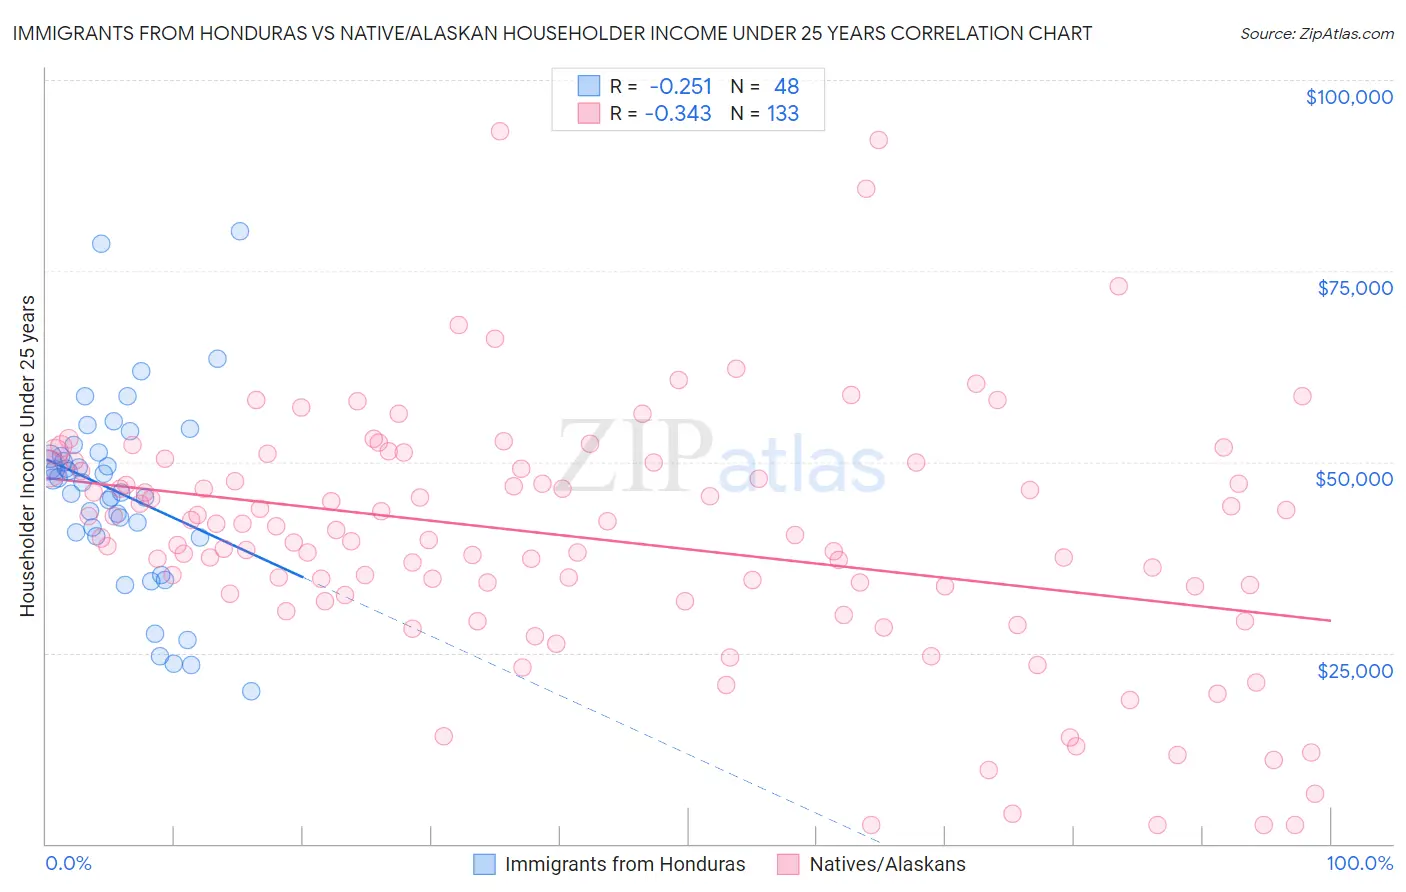
Immigrants from Honduras vs Native/Alaskan Householder Income Under 25 years Correlation Chart
The statistical analysis conducted on geographies consisting of 280,925,483 people shows a weak negative correlation between the proportion of Immigrants from Honduras and household income with householder under the age of 25 in the United States with a correlation coefficient (R) of -0.251 and weighted average of $48,267. Similarly, the statistical analysis conducted on geographies consisting of 416,135,889 people shows a mild negative correlation between the proportion of Natives/Alaskans and household income with householder under the age of 25 in the United States with a correlation coefficient (R) of -0.343 and weighted average of $47,704, a difference of 1.2%.
Householder Income Under 25 years Correlation Summary
| Measurement | Immigrants from Honduras | Native/Alaskan |
| Minimum | $19,963 | $2,499 |
| Maximum | $80,192 | $93,365 |
| Range | $60,229 | $90,866 |
| Mean | $45,959 | $40,011 |
| Median | $47,527 | $40,469 |
| Interquartile 25% (IQ1) | $40,556 | $32,640 |
| Interquartile 75% (IQ3) | $51,008 | $49,547 |
| Interquartile Range (IQR) | $10,452 | $16,907 |
| Standard Deviation (Sample) | $12,342 | $16,339 |
| Standard Deviation (Population) | $12,213 | $16,277 |
Demographics Similar to Immigrants from Honduras and Natives/Alaskans by Householder Income Under 25 years
In terms of householder income under 25 years, the demographic groups most similar to Immigrants from Honduras are Yaqui ($48,300, a difference of 0.070%), Immigrants from Somalia ($48,135, a difference of 0.27%), Immigrants from Kuwait ($48,126, a difference of 0.29%), Cree ($48,514, a difference of 0.51%), and Immigrants from Liberia ($47,981, a difference of 0.60%). Similarly, the demographic groups most similar to Natives/Alaskans are Bangladeshi ($47,589, a difference of 0.24%), Cherokee ($47,848, a difference of 0.30%), Comanche ($47,518, a difference of 0.39%), Menominee ($47,907, a difference of 0.43%), and Immigrants from Middle Africa ($47,916, a difference of 0.44%).
| Demographics | Rating | Rank | Householder Income Under 25 years |
| Shoshone | 0.0 /100 | #292 | Tragic $48,720 |
| Sub-Saharan Africans | 0.0 /100 | #293 | Tragic $48,691 |
| Somalis | 0.0 /100 | #294 | Tragic $48,657 |
| Central American Indians | 0.0 /100 | #295 | Tragic $48,643 |
| Blackfeet | 0.0 /100 | #296 | Tragic $48,603 |
| Cree | 0.0 /100 | #297 | Tragic $48,514 |
| Yaqui | 0.0 /100 | #298 | Tragic $48,300 |
| Immigrants | Honduras | 0.0 /100 | #299 | Tragic $48,267 |
| Immigrants | Somalia | 0.0 /100 | #300 | Tragic $48,135 |
| Immigrants | Kuwait | 0.0 /100 | #301 | Tragic $48,126 |
| Immigrants | Liberia | 0.0 /100 | #302 | Tragic $47,981 |
| Immigrants | Middle Africa | 0.0 /100 | #303 | Tragic $47,916 |
| Menominee | 0.0 /100 | #304 | Tragic $47,907 |
| Cherokee | 0.0 /100 | #305 | Tragic $47,848 |
| Natives/Alaskans | 0.0 /100 | #306 | Tragic $47,704 |
| Bangladeshis | 0.0 /100 | #307 | Tragic $47,589 |
| Comanche | 0.0 /100 | #308 | Tragic $47,518 |
| U.S. Virgin Islanders | 0.0 /100 | #309 | Tragic $47,448 |
| Iroquois | 0.0 /100 | #310 | Tragic $47,380 |
| Ottawa | 0.0 /100 | #311 | Tragic $47,366 |
| Bermudans | 0.0 /100 | #312 | Tragic $47,359 |