Immigrants from Honduras vs Bulgarian Householder Income Ages 45 - 64 years
COMPARE
Immigrants from Honduras
Bulgarian
Householder Income Ages 45 - 64 years
Householder Income Ages 45 - 64 years Comparison
Immigrants from Honduras
Bulgarians
$82,697
HOUSEHOLDER INCOME AGES 45 - 64 YEARS
0.0/ 100
METRIC RATING
314th/ 347
METRIC RANK
$113,883
HOUSEHOLDER INCOME AGES 45 - 64 YEARS
99.9/ 100
METRIC RATING
44th/ 347
METRIC RANK
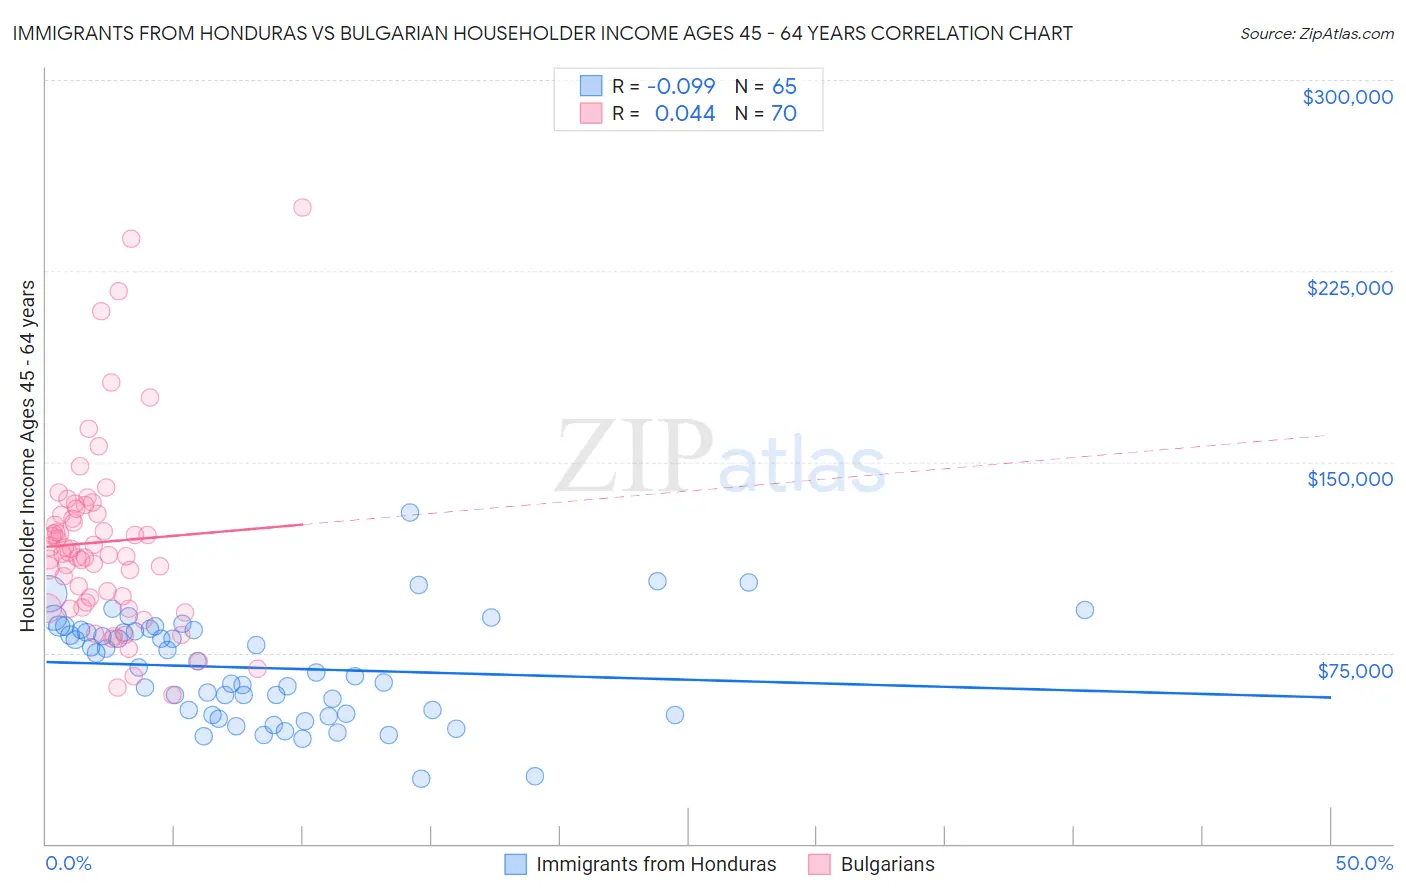
Immigrants from Honduras vs Bulgarian Householder Income Ages 45 - 64 years Correlation Chart
The statistical analysis conducted on geographies consisting of 322,186,782 people shows a slight negative correlation between the proportion of Immigrants from Honduras and household income with householder between the ages 45 and 64 in the United States with a correlation coefficient (R) of -0.099 and weighted average of $82,697. Similarly, the statistical analysis conducted on geographies consisting of 205,498,500 people shows no correlation between the proportion of Bulgarians and household income with householder between the ages 45 and 64 in the United States with a correlation coefficient (R) of 0.044 and weighted average of $113,883, a difference of 37.7%.
Householder Income Ages 45 - 64 years Correlation Summary
| Measurement | Immigrants from Honduras | Bulgarian |
| Minimum | $25,625 | $58,365 |
| Maximum | $130,200 | $250,001 |
| Range | $104,575 | $191,636 |
| Mean | $69,055 | $118,506 |
| Median | $69,386 | $114,293 |
| Interquartile 25% (IQ1) | $50,934 | $94,899 |
| Interquartile 75% (IQ3) | $83,889 | $129,526 |
| Interquartile Range (IQR) | $32,956 | $34,627 |
| Standard Deviation (Sample) | $20,449 | $36,891 |
| Standard Deviation (Population) | $20,291 | $36,627 |
Similar Demographics by Householder Income Ages 45 - 64 years
Demographics Similar to Immigrants from Honduras by Householder Income Ages 45 - 64 years
In terms of householder income ages 45 - 64 years, the demographic groups most similar to Immigrants from Honduras are U.S. Virgin Islander ($82,736, a difference of 0.050%), Paiute ($82,629, a difference of 0.080%), Immigrants from Caribbean ($82,513, a difference of 0.22%), Colville ($82,474, a difference of 0.27%), and Cajun ($83,015, a difference of 0.39%).
| Demographics | Rating | Rank | Householder Income Ages 45 - 64 years |
| Shoshone | 0.0 /100 | #307 | Tragic $83,588 |
| Immigrants | Cabo Verde | 0.0 /100 | #308 | Tragic $83,542 |
| Immigrants | Dominica | 0.0 /100 | #309 | Tragic $83,311 |
| Immigrants | Haiti | 0.0 /100 | #310 | Tragic $83,257 |
| Immigrants | Bahamas | 0.0 /100 | #311 | Tragic $83,177 |
| Cajuns | 0.0 /100 | #312 | Tragic $83,015 |
| U.S. Virgin Islanders | 0.0 /100 | #313 | Tragic $82,736 |
| Immigrants | Honduras | 0.0 /100 | #314 | Tragic $82,697 |
| Paiute | 0.0 /100 | #315 | Tragic $82,629 |
| Immigrants | Caribbean | 0.0 /100 | #316 | Tragic $82,513 |
| Colville | 0.0 /100 | #317 | Tragic $82,474 |
| Choctaw | 0.0 /100 | #318 | Tragic $82,287 |
| Chickasaw | 0.0 /100 | #319 | Tragic $82,193 |
| Apache | 0.0 /100 | #320 | Tragic $82,184 |
| Yuman | 0.0 /100 | #321 | Tragic $82,139 |
Demographics Similar to Bulgarians by Householder Income Ages 45 - 64 years
In terms of householder income ages 45 - 64 years, the demographic groups most similar to Bulgarians are Immigrants from France ($113,680, a difference of 0.18%), Israeli ($114,186, a difference of 0.27%), Immigrants from Greece ($113,548, a difference of 0.29%), Estonian ($114,220, a difference of 0.30%), and Australian ($113,533, a difference of 0.31%).
| Demographics | Rating | Rank | Householder Income Ages 45 - 64 years |
| Maltese | 99.9 /100 | #37 | Exceptional $114,754 |
| Immigrants | Pakistan | 99.9 /100 | #38 | Exceptional $114,434 |
| Immigrants | Turkey | 99.9 /100 | #39 | Exceptional $114,407 |
| Cambodians | 99.9 /100 | #40 | Exceptional $114,342 |
| Immigrants | Lithuania | 99.9 /100 | #41 | Exceptional $114,336 |
| Estonians | 99.9 /100 | #42 | Exceptional $114,220 |
| Israelis | 99.9 /100 | #43 | Exceptional $114,186 |
| Bulgarians | 99.9 /100 | #44 | Exceptional $113,883 |
| Immigrants | France | 99.9 /100 | #45 | Exceptional $113,680 |
| Immigrants | Greece | 99.9 /100 | #46 | Exceptional $113,548 |
| Australians | 99.9 /100 | #47 | Exceptional $113,533 |
| Immigrants | Indonesia | 99.9 /100 | #48 | Exceptional $113,519 |
| Immigrants | Russia | 99.8 /100 | #49 | Exceptional $113,215 |
| Immigrants | Austria | 99.8 /100 | #50 | Exceptional $113,140 |
| Immigrants | South Africa | 99.8 /100 | #51 | Exceptional $112,886 |