Immigrants from Haiti vs Yup'ik Unemployment Among Ages 35 to 44 years
COMPARE
Immigrants from Haiti
Yup'ik
Unemployment Among Ages 35 to 44 years
Unemployment Among Ages 35 to 44 years Comparison
Immigrants from Haiti
Yup'ik
5.5%
UNEMPLOYMENT AMONG AGES 35 TO 44 YEARS
0.0/ 100
METRIC RATING
292nd/ 347
METRIC RANK
14.4%
UNEMPLOYMENT AMONG AGES 35 TO 44 YEARS
0.0/ 100
METRIC RATING
345th/ 347
METRIC RANK
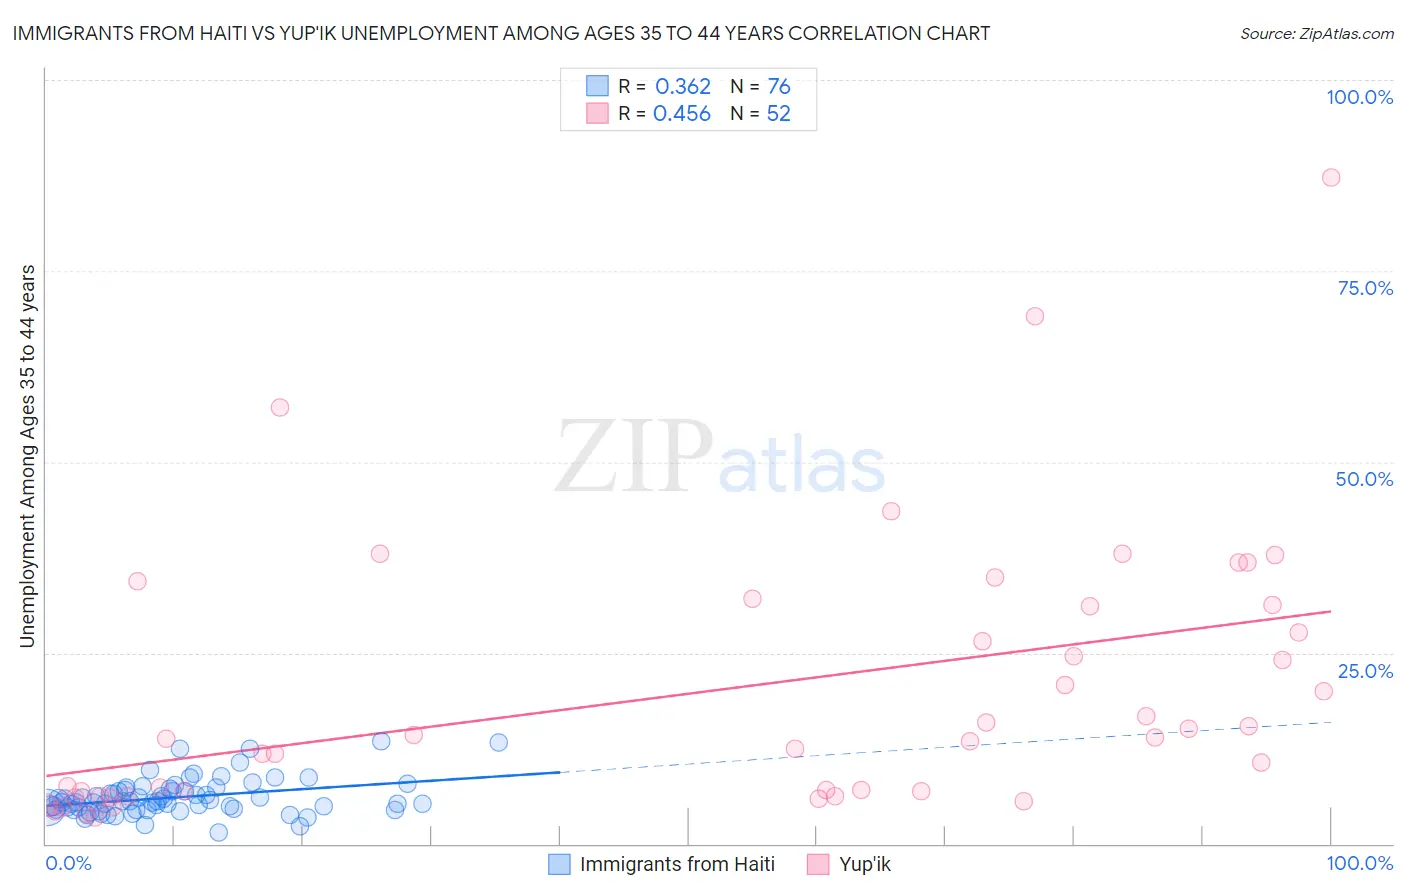
Immigrants from Haiti vs Yup'ik Unemployment Among Ages 35 to 44 years Correlation Chart
The statistical analysis conducted on geographies consisting of 222,596,804 people shows a mild positive correlation between the proportion of Immigrants from Haiti and unemployment rate among population between the ages 35 and 44 in the United States with a correlation coefficient (R) of 0.362 and weighted average of 5.5%. Similarly, the statistical analysis conducted on geographies consisting of 39,745,943 people shows a moderate positive correlation between the proportion of Yup'ik and unemployment rate among population between the ages 35 and 44 in the United States with a correlation coefficient (R) of 0.456 and weighted average of 14.4%, a difference of 160.3%.
Unemployment Among Ages 35 to 44 years Correlation Summary
| Measurement | Immigrants from Haiti | Yup'ik |
| Minimum | 1.5% | 3.5% |
| Maximum | 13.4% | 87.2% |
| Range | 11.9% | 83.8% |
| Mean | 6.1% | 19.9% |
| Median | 5.5% | 13.8% |
| Interquartile 25% (IQ1) | 4.6% | 6.6% |
| Interquartile 75% (IQ3) | 6.9% | 31.2% |
| Interquartile Range (IQR) | 2.4% | 24.6% |
| Standard Deviation (Sample) | 2.4% | 17.6% |
| Standard Deviation (Population) | 2.3% | 17.5% |
Similar Demographics by Unemployment Among Ages 35 to 44 years
Demographics Similar to Immigrants from Haiti by Unemployment Among Ages 35 to 44 years
In terms of unemployment among ages 35 to 44 years, the demographic groups most similar to Immigrants from Haiti are Dutch West Indian (5.5%, a difference of 0.16%), Central American Indian (5.6%, a difference of 0.23%), Trinidadian and Tobagonian (5.6%, a difference of 0.23%), Jamaican (5.5%, a difference of 0.26%), and Spanish American Indian (5.5%, a difference of 0.34%).
| Demographics | Rating | Rank | Unemployment Among Ages 35 to 44 years |
| Hispanics or Latinos | 0.0 /100 | #285 | Tragic 5.5% |
| Immigrants | Micronesia | 0.0 /100 | #286 | Tragic 5.5% |
| French American Indians | 0.0 /100 | #287 | Tragic 5.5% |
| Cree | 0.0 /100 | #288 | Tragic 5.5% |
| Spanish American Indians | 0.0 /100 | #289 | Tragic 5.5% |
| Jamaicans | 0.0 /100 | #290 | Tragic 5.5% |
| Dutch West Indians | 0.0 /100 | #291 | Tragic 5.5% |
| Immigrants | Haiti | 0.0 /100 | #292 | Tragic 5.5% |
| Central American Indians | 0.0 /100 | #293 | Tragic 5.6% |
| Trinidadians and Tobagonians | 0.0 /100 | #294 | Tragic 5.6% |
| Ottawa | 0.0 /100 | #295 | Tragic 5.6% |
| Immigrants | Trinidad and Tobago | 0.0 /100 | #296 | Tragic 5.6% |
| U.S. Virgin Islanders | 0.0 /100 | #297 | Tragic 5.6% |
| Aleuts | 0.0 /100 | #298 | Tragic 5.6% |
| Immigrants | Jamaica | 0.0 /100 | #299 | Tragic 5.6% |
Demographics Similar to Yup'ik by Unemployment Among Ages 35 to 44 years
In terms of unemployment among ages 35 to 44 years, the demographic groups most similar to Yup'ik are Crow (15.7%, a difference of 8.8%), Yuman (16.9%, a difference of 17.2%), Pima (11.8%, a difference of 22.8%), Arapaho (10.3%, a difference of 40.3%), and Navajo (9.3%, a difference of 54.6%).
| Demographics | Rating | Rank | Unemployment Among Ages 35 to 44 years |
| Puerto Ricans | 0.0 /100 | #333 | Tragic 7.6% |
| Houma | 0.0 /100 | #334 | Tragic 7.8% |
| Sioux | 0.0 /100 | #335 | Tragic 8.4% |
| Apache | 0.0 /100 | #336 | Tragic 8.4% |
| Tohono O'odham | 0.0 /100 | #337 | Tragic 8.4% |
| Cheyenne | 0.0 /100 | #338 | Tragic 8.5% |
| Inupiat | 0.0 /100 | #339 | Tragic 8.6% |
| Alaskan Athabascans | 0.0 /100 | #340 | Tragic 8.6% |
| Hopi | 0.0 /100 | #341 | Tragic 8.9% |
| Navajo | 0.0 /100 | #342 | Tragic 9.3% |
| Arapaho | 0.0 /100 | #343 | Tragic 10.3% |
| Pima | 0.0 /100 | #344 | Tragic 11.8% |
| Yup'ik | 0.0 /100 | #345 | Tragic 14.4% |
| Crow | 0.0 /100 | #346 | Tragic 15.7% |
| Yuman | 0.0 /100 | #347 | Tragic 16.9% |