Immigrants from Haiti vs Immigrants from Dominican Republic Householder Income Over 65 years
COMPARE
Immigrants from Haiti
Immigrants from Dominican Republic
Householder Income Over 65 years
Householder Income Over 65 years Comparison
Immigrants from Haiti
Immigrants from Dominican Republic
$51,219
HOUSEHOLDER INCOME OVER 65 YEARS
0.0/ 100
METRIC RATING
325th/ 347
METRIC RANK
$45,758
HOUSEHOLDER INCOME OVER 65 YEARS
0.0/ 100
METRIC RATING
343rd/ 347
METRIC RANK
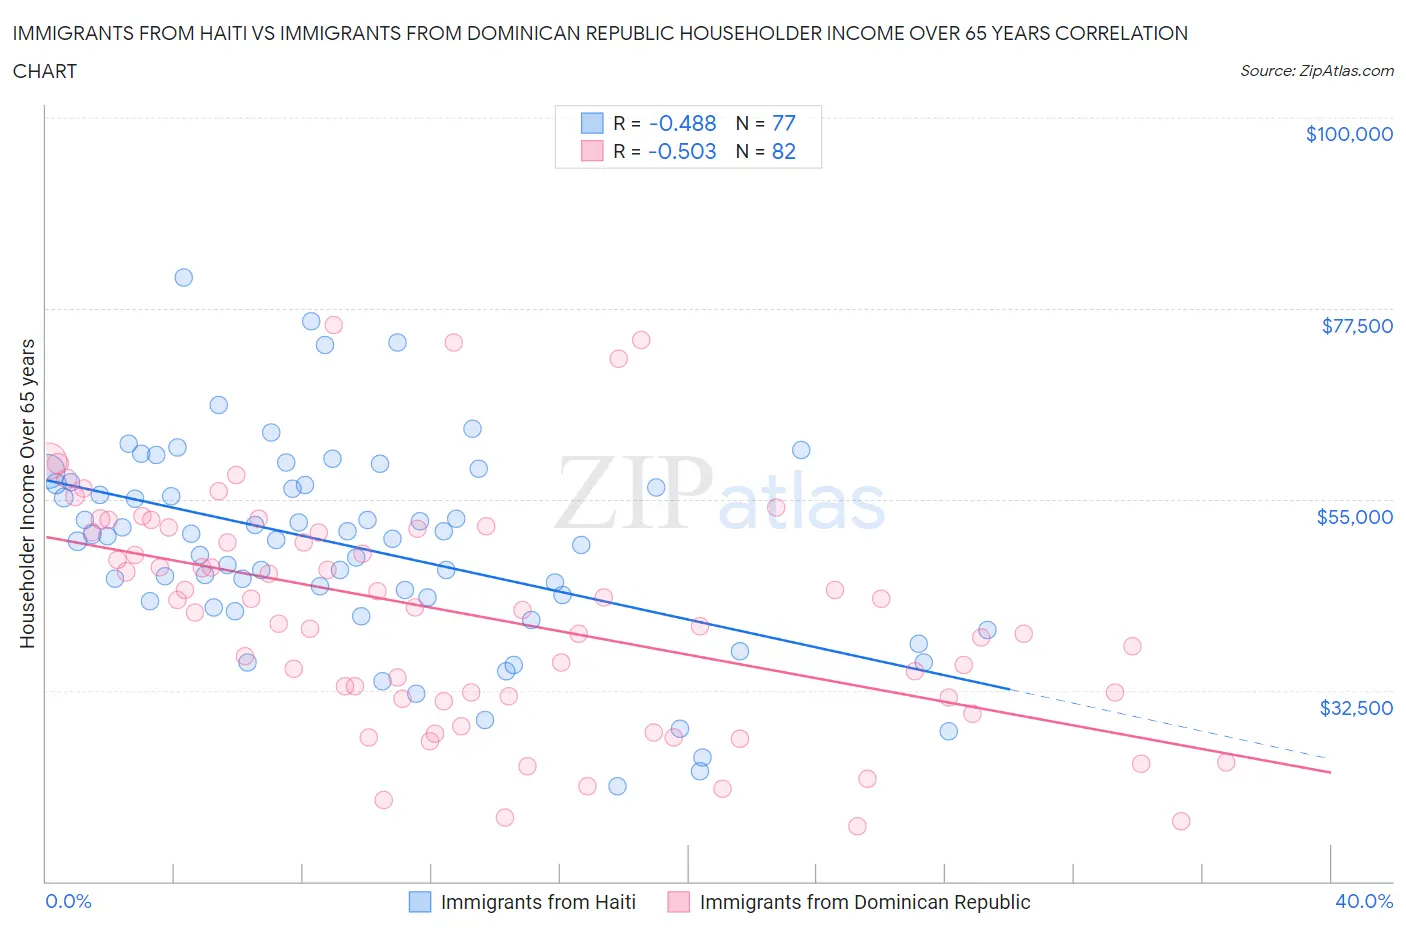
Immigrants from Haiti vs Immigrants from Dominican Republic Householder Income Over 65 years Correlation Chart
The statistical analysis conducted on geographies consisting of 224,664,590 people shows a moderate negative correlation between the proportion of Immigrants from Haiti and household income with householder over the age of 65 in the United States with a correlation coefficient (R) of -0.488 and weighted average of $51,219. Similarly, the statistical analysis conducted on geographies consisting of 274,205,000 people shows a substantial negative correlation between the proportion of Immigrants from Dominican Republic and household income with householder over the age of 65 in the United States with a correlation coefficient (R) of -0.503 and weighted average of $45,758, a difference of 11.9%.
Householder Income Over 65 years Correlation Summary
| Measurement | Immigrants from Haiti | Immigrants from Dominican Republic |
| Minimum | $21,207 | $16,438 |
| Maximum | $81,196 | $75,483 |
| Range | $59,989 | $59,045 |
| Mean | $49,285 | $41,431 |
| Median | $50,337 | $42,056 |
| Interquartile 25% (IQ1) | $42,656 | $31,687 |
| Interquartile 75% (IQ3) | $56,737 | $51,139 |
| Interquartile Range (IQR) | $14,081 | $19,452 |
| Standard Deviation (Sample) | $11,917 | $13,458 |
| Standard Deviation (Population) | $11,839 | $13,375 |
Demographics Similar to Immigrants from Haiti and Immigrants from Dominican Republic by Householder Income Over 65 years
In terms of householder income over 65 years, the demographic groups most similar to Immigrants from Haiti are Kiowa ($51,140, a difference of 0.15%), Immigrants from Congo ($51,393, a difference of 0.34%), Bahamian ($51,000, a difference of 0.43%), Hopi ($50,925, a difference of 0.58%), and Black/African American ($50,779, a difference of 0.87%). Similarly, the demographic groups most similar to Immigrants from Dominican Republic are Immigrants from Cabo Verde ($46,654, a difference of 2.0%), Houma ($44,822, a difference of 2.1%), Dominican ($46,964, a difference of 2.6%), Immigrants from Yemen ($47,527, a difference of 3.9%), and Navajo ($47,722, a difference of 4.3%).
| Demographics | Rating | Rank | Householder Income Over 65 years |
| Immigrants | Congo | 0.0 /100 | #324 | Tragic $51,393 |
| Immigrants | Haiti | 0.0 /100 | #325 | Tragic $51,219 |
| Kiowa | 0.0 /100 | #326 | Tragic $51,140 |
| Bahamians | 0.0 /100 | #327 | Tragic $51,000 |
| Hopi | 0.0 /100 | #328 | Tragic $50,925 |
| Blacks/African Americans | 0.0 /100 | #329 | Tragic $50,779 |
| Immigrants | Grenada | 0.0 /100 | #330 | Tragic $50,747 |
| Pima | 0.0 /100 | #331 | Tragic $50,539 |
| Dutch West Indians | 0.0 /100 | #332 | Tragic $50,475 |
| Cape Verdeans | 0.0 /100 | #333 | Tragic $50,077 |
| Immigrants | Dominica | 0.0 /100 | #334 | Tragic $50,071 |
| Crow | 0.0 /100 | #335 | Tragic $49,234 |
| Cubans | 0.0 /100 | #336 | Tragic $49,152 |
| Tohono O'odham | 0.0 /100 | #337 | Tragic $49,121 |
| Immigrants | Caribbean | 0.0 /100 | #338 | Tragic $48,535 |
| Navajo | 0.0 /100 | #339 | Tragic $47,722 |
| Immigrants | Yemen | 0.0 /100 | #340 | Tragic $47,527 |
| Dominicans | 0.0 /100 | #341 | Tragic $46,964 |
| Immigrants | Cabo Verde | 0.0 /100 | #342 | Tragic $46,654 |
| Immigrants | Dominican Republic | 0.0 /100 | #343 | Tragic $45,758 |
| Houma | 0.0 /100 | #344 | Tragic $44,822 |