Immigrants from Philippines vs Immigrants from Dominican Republic Householder Income Over 65 years
COMPARE
Immigrants from Philippines
Immigrants from Dominican Republic
Householder Income Over 65 years
Householder Income Over 65 years Comparison
Immigrants from Philippines
Immigrants from Dominican Republic
$66,161
HOUSEHOLDER INCOME OVER 65 YEARS
99.6/ 100
METRIC RATING
58th/ 347
METRIC RANK
$45,758
HOUSEHOLDER INCOME OVER 65 YEARS
0.0/ 100
METRIC RATING
343rd/ 347
METRIC RANK
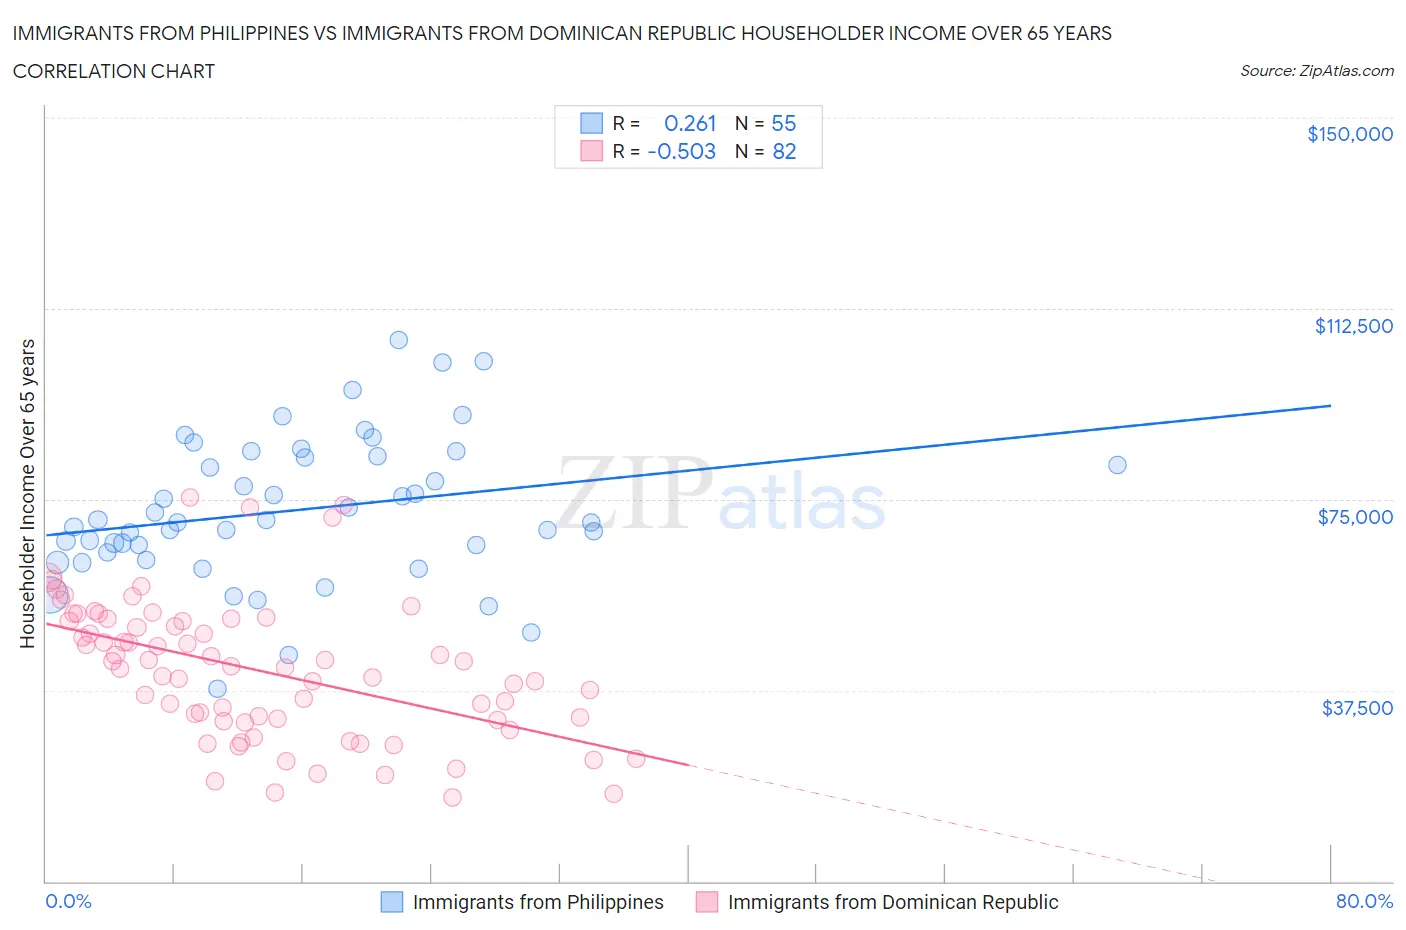
Immigrants from Philippines vs Immigrants from Dominican Republic Householder Income Over 65 years Correlation Chart
The statistical analysis conducted on geographies consisting of 469,098,262 people shows a weak positive correlation between the proportion of Immigrants from Philippines and household income with householder over the age of 65 in the United States with a correlation coefficient (R) of 0.261 and weighted average of $66,161. Similarly, the statistical analysis conducted on geographies consisting of 274,205,000 people shows a substantial negative correlation between the proportion of Immigrants from Dominican Republic and household income with householder over the age of 65 in the United States with a correlation coefficient (R) of -0.503 and weighted average of $45,758, a difference of 44.6%.
Householder Income Over 65 years Correlation Summary
| Measurement | Immigrants from Philippines | Immigrants from Dominican Republic |
| Minimum | $37,713 | $16,438 |
| Maximum | $106,262 | $75,483 |
| Range | $68,549 | $59,045 |
| Mean | $72,886 | $41,431 |
| Median | $70,497 | $42,056 |
| Interquartile 25% (IQ1) | $64,489 | $31,687 |
| Interquartile 75% (IQ3) | $83,466 | $51,139 |
| Interquartile Range (IQR) | $18,977 | $19,452 |
| Standard Deviation (Sample) | $14,178 | $13,458 |
| Standard Deviation (Population) | $14,049 | $13,375 |
Similar Demographics by Householder Income Over 65 years
Demographics Similar to Immigrants from Philippines by Householder Income Over 65 years
In terms of householder income over 65 years, the demographic groups most similar to Immigrants from Philippines are Immigrants from Norway ($66,118, a difference of 0.060%), Bulgarian ($66,236, a difference of 0.11%), Immigrants from Lithuania ($66,087, a difference of 0.11%), Maltese ($66,027, a difference of 0.20%), and Laotian ($66,306, a difference of 0.22%).
| Demographics | Rating | Rank | Householder Income Over 65 years |
| Israelis | 99.7 /100 | #51 | Exceptional $66,636 |
| Immigrants | Scotland | 99.7 /100 | #52 | Exceptional $66,620 |
| Immigrants | Pakistan | 99.7 /100 | #53 | Exceptional $66,617 |
| Immigrants | Netherlands | 99.7 /100 | #54 | Exceptional $66,463 |
| Immigrants | Czechoslovakia | 99.7 /100 | #55 | Exceptional $66,376 |
| Laotians | 99.6 /100 | #56 | Exceptional $66,306 |
| Bulgarians | 99.6 /100 | #57 | Exceptional $66,236 |
| Immigrants | Philippines | 99.6 /100 | #58 | Exceptional $66,161 |
| Immigrants | Norway | 99.5 /100 | #59 | Exceptional $66,118 |
| Immigrants | Lithuania | 99.5 /100 | #60 | Exceptional $66,087 |
| Maltese | 99.5 /100 | #61 | Exceptional $66,027 |
| Immigrants | Sierra Leone | 99.5 /100 | #62 | Exceptional $66,009 |
| Marshallese | 99.4 /100 | #63 | Exceptional $65,874 |
| Zimbabweans | 99.4 /100 | #64 | Exceptional $65,854 |
| Immigrants | England | 99.3 /100 | #65 | Exceptional $65,715 |
Demographics Similar to Immigrants from Dominican Republic by Householder Income Over 65 years
In terms of householder income over 65 years, the demographic groups most similar to Immigrants from Dominican Republic are Immigrants from Cabo Verde ($46,654, a difference of 2.0%), Houma ($44,822, a difference of 2.1%), Immigrants from Cuba ($44,735, a difference of 2.3%), Dominican ($46,964, a difference of 2.6%), and Immigrants from Yemen ($47,527, a difference of 3.9%).
| Demographics | Rating | Rank | Householder Income Over 65 years |
| Cape Verdeans | 0.0 /100 | #333 | Tragic $50,077 |
| Immigrants | Dominica | 0.0 /100 | #334 | Tragic $50,071 |
| Crow | 0.0 /100 | #335 | Tragic $49,234 |
| Cubans | 0.0 /100 | #336 | Tragic $49,152 |
| Tohono O'odham | 0.0 /100 | #337 | Tragic $49,121 |
| Immigrants | Caribbean | 0.0 /100 | #338 | Tragic $48,535 |
| Navajo | 0.0 /100 | #339 | Tragic $47,722 |
| Immigrants | Yemen | 0.0 /100 | #340 | Tragic $47,527 |
| Dominicans | 0.0 /100 | #341 | Tragic $46,964 |
| Immigrants | Cabo Verde | 0.0 /100 | #342 | Tragic $46,654 |
| Immigrants | Dominican Republic | 0.0 /100 | #343 | Tragic $45,758 |
| Houma | 0.0 /100 | #344 | Tragic $44,822 |
| Immigrants | Cuba | 0.0 /100 | #345 | Tragic $44,735 |
| Puerto Ricans | 0.0 /100 | #346 | Tragic $42,550 |
| Lumbee | 0.0 /100 | #347 | Tragic $40,550 |