Immigrants from Haiti vs Honduran Householder Income Over 65 years
COMPARE
Immigrants from Haiti
Honduran
Householder Income Over 65 years
Householder Income Over 65 years Comparison
Immigrants from Haiti
Hondurans
$51,219
HOUSEHOLDER INCOME OVER 65 YEARS
0.0/ 100
METRIC RATING
325th/ 347
METRIC RANK
$52,634
HOUSEHOLDER INCOME OVER 65 YEARS
0.0/ 100
METRIC RATING
309th/ 347
METRIC RANK
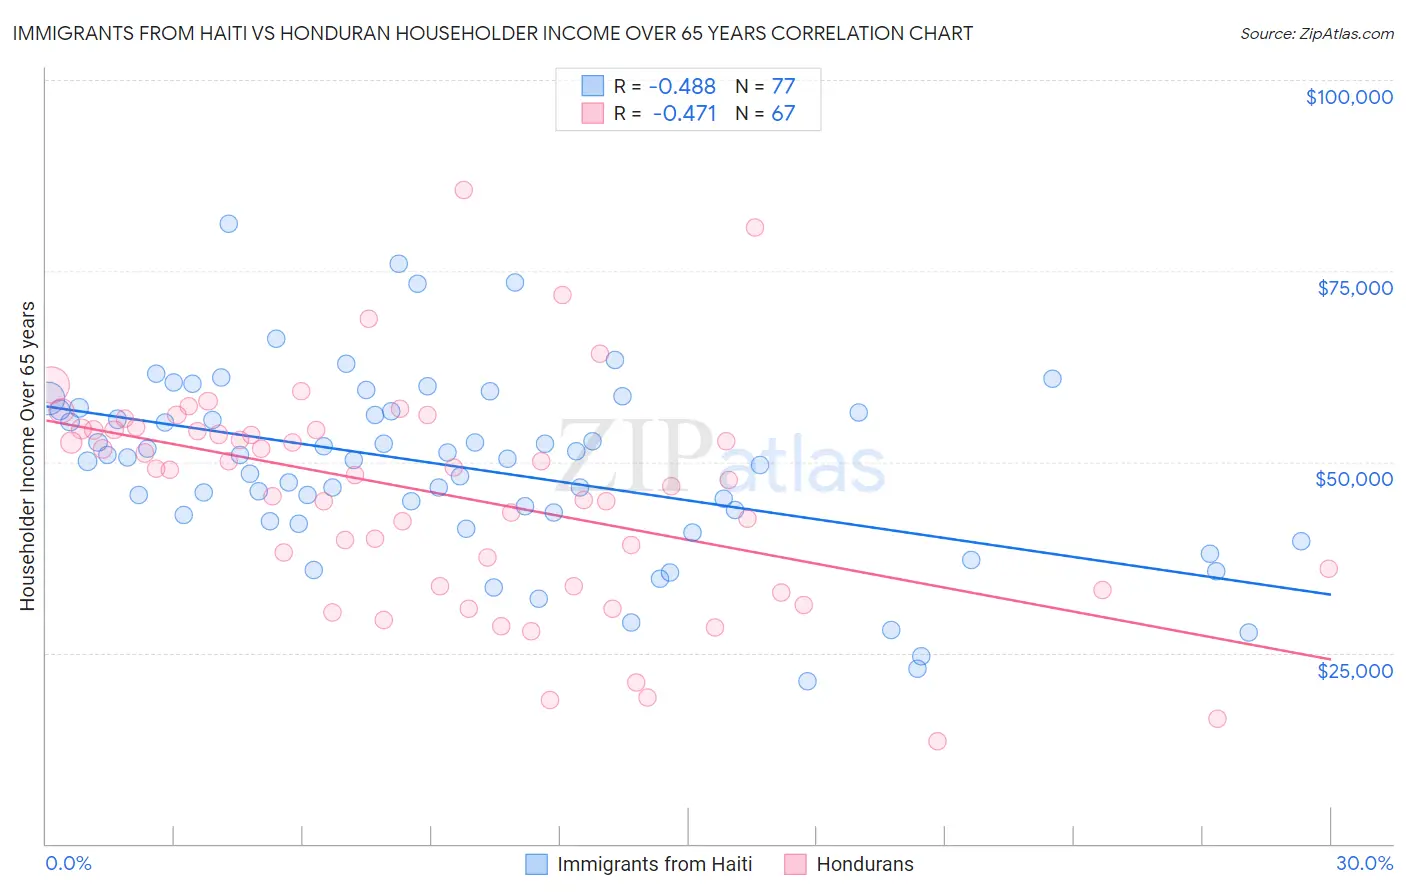
Immigrants from Haiti vs Honduran Householder Income Over 65 years Correlation Chart
The statistical analysis conducted on geographies consisting of 224,664,590 people shows a moderate negative correlation between the proportion of Immigrants from Haiti and household income with householder over the age of 65 in the United States with a correlation coefficient (R) of -0.488 and weighted average of $51,219. Similarly, the statistical analysis conducted on geographies consisting of 356,652,935 people shows a moderate negative correlation between the proportion of Hondurans and household income with householder over the age of 65 in the United States with a correlation coefficient (R) of -0.471 and weighted average of $52,634, a difference of 2.8%.
Householder Income Over 65 years Correlation Summary
| Measurement | Immigrants from Haiti | Honduran |
| Minimum | $21,207 | $13,371 |
| Maximum | $81,196 | $85,625 |
| Range | $59,989 | $72,254 |
| Mean | $49,285 | $45,868 |
| Median | $50,337 | $48,924 |
| Interquartile 25% (IQ1) | $42,656 | $33,750 |
| Interquartile 75% (IQ3) | $56,737 | $54,223 |
| Interquartile Range (IQR) | $14,081 | $20,473 |
| Standard Deviation (Sample) | $11,917 | $14,320 |
| Standard Deviation (Population) | $11,839 | $14,213 |
Demographics Similar to Immigrants from Haiti and Hondurans by Householder Income Over 65 years
In terms of householder income over 65 years, the demographic groups most similar to Immigrants from Haiti are Kiowa ($51,140, a difference of 0.15%), Immigrants from Congo ($51,393, a difference of 0.34%), Cajun ($51,397, a difference of 0.35%), Bahamian ($51,000, a difference of 0.43%), and British West Indian ($51,463, a difference of 0.47%). Similarly, the demographic groups most similar to Hondurans are Sioux ($52,509, a difference of 0.24%), Immigrants from Mexico ($52,801, a difference of 0.32%), Hispanic or Latino ($52,832, a difference of 0.38%), Seminole ($52,373, a difference of 0.50%), and Immigrants from the Azores ($52,121, a difference of 0.98%).
| Demographics | Rating | Rank | Householder Income Over 65 years |
| Hispanics or Latinos | 0.0 /100 | #307 | Tragic $52,832 |
| Immigrants | Mexico | 0.0 /100 | #308 | Tragic $52,801 |
| Hondurans | 0.0 /100 | #309 | Tragic $52,634 |
| Sioux | 0.0 /100 | #310 | Tragic $52,509 |
| Seminole | 0.0 /100 | #311 | Tragic $52,373 |
| Immigrants | Azores | 0.0 /100 | #312 | Tragic $52,121 |
| Immigrants | Nicaragua | 0.0 /100 | #313 | Tragic $52,085 |
| Natives/Alaskans | 0.0 /100 | #314 | Tragic $52,081 |
| U.S. Virgin Islanders | 0.0 /100 | #315 | Tragic $52,072 |
| Creek | 0.0 /100 | #316 | Tragic $51,949 |
| Immigrants | St. Vincent and the Grenadines | 0.0 /100 | #317 | Tragic $51,922 |
| Haitians | 0.0 /100 | #318 | Tragic $51,912 |
| Immigrants | Honduras | 0.0 /100 | #319 | Tragic $51,888 |
| Colville | 0.0 /100 | #320 | Tragic $51,739 |
| Menominee | 0.0 /100 | #321 | Tragic $51,719 |
| British West Indians | 0.0 /100 | #322 | Tragic $51,463 |
| Cajuns | 0.0 /100 | #323 | Tragic $51,397 |
| Immigrants | Congo | 0.0 /100 | #324 | Tragic $51,393 |
| Immigrants | Haiti | 0.0 /100 | #325 | Tragic $51,219 |
| Kiowa | 0.0 /100 | #326 | Tragic $51,140 |
| Bahamians | 0.0 /100 | #327 | Tragic $51,000 |