Immigrants from Haiti vs Immigrants from Dominican Republic Female Poverty Among 18-24 Year Olds
COMPARE
Immigrants from Haiti
Immigrants from Dominican Republic
Female Poverty Among 18-24 Year Olds
Female Poverty Among 18-24 Year Olds Comparison
Immigrants from Haiti
Immigrants from Dominican Republic
18.7%
FEMALE POVERTY AMONG 18-24 YEAR OLDS
99.7/ 100
METRIC RATING
71st/ 347
METRIC RANK
21.9%
FEMALE POVERTY AMONG 18-24 YEAR OLDS
0.1/ 100
METRIC RATING
281st/ 347
METRIC RANK
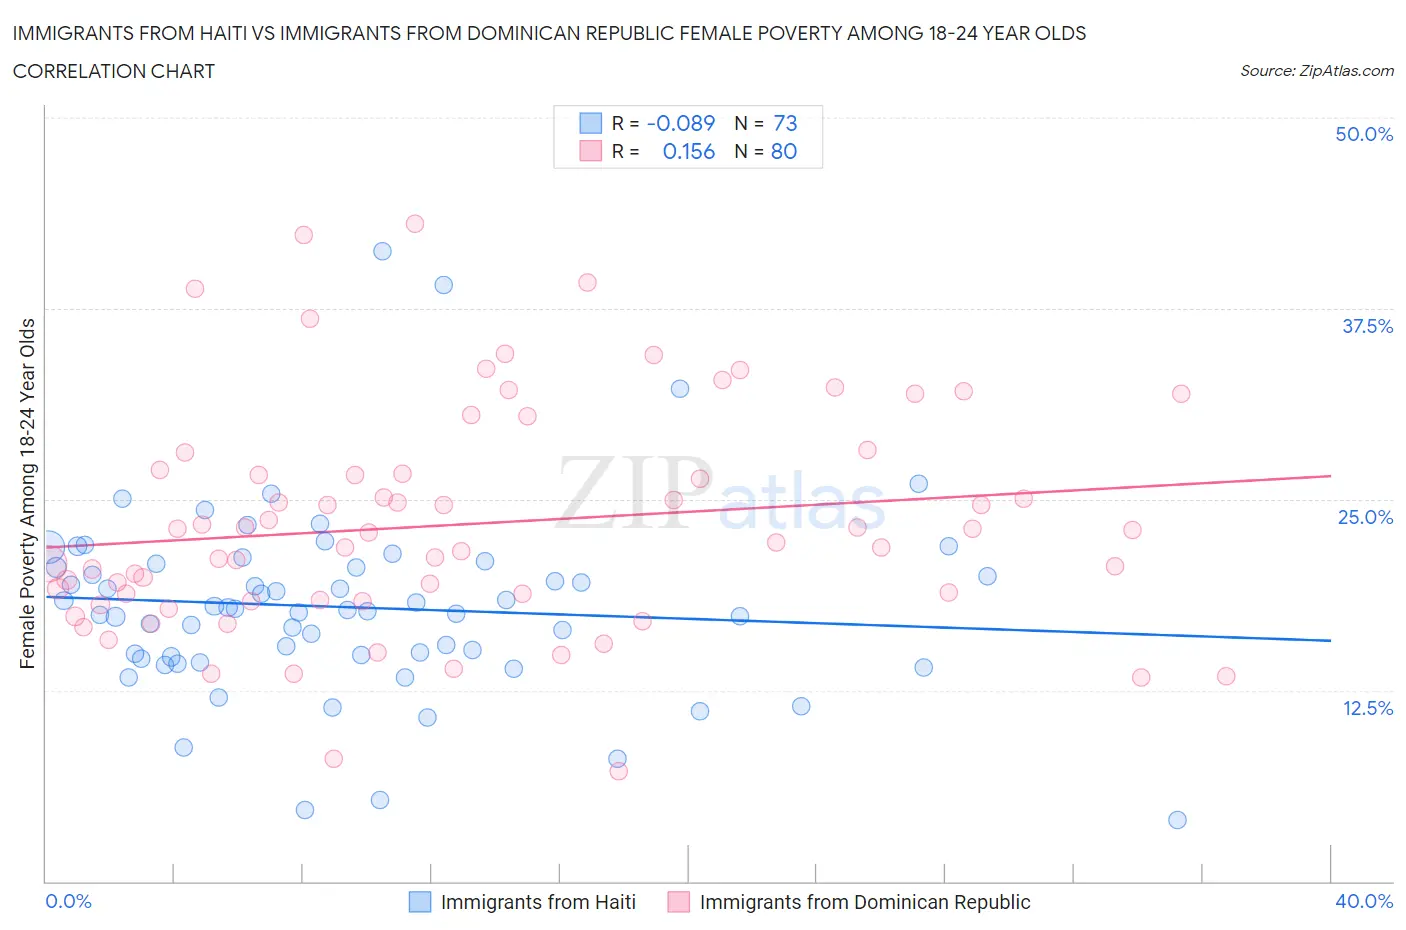
Immigrants from Haiti vs Immigrants from Dominican Republic Female Poverty Among 18-24 Year Olds Correlation Chart
The statistical analysis conducted on geographies consisting of 221,211,252 people shows a slight negative correlation between the proportion of Immigrants from Haiti and poverty level among females between the ages 18 and 24 in the United States with a correlation coefficient (R) of -0.089 and weighted average of 18.7%. Similarly, the statistical analysis conducted on geographies consisting of 269,456,906 people shows a poor positive correlation between the proportion of Immigrants from Dominican Republic and poverty level among females between the ages 18 and 24 in the United States with a correlation coefficient (R) of 0.156 and weighted average of 21.9%, a difference of 17.4%.
Female Poverty Among 18-24 Year Olds Correlation Summary
| Measurement | Immigrants from Haiti | Immigrants from Dominican Republic |
| Minimum | 4.0% | 7.2% |
| Maximum | 41.2% | 43.1% |
| Range | 37.2% | 35.8% |
| Mean | 17.9% | 23.4% |
| Median | 17.7% | 22.5% |
| Interquartile 25% (IQ1) | 14.6% | 18.4% |
| Interquartile 75% (IQ3) | 20.7% | 26.8% |
| Interquartile Range (IQR) | 6.0% | 8.4% |
| Standard Deviation (Sample) | 6.2% | 7.4% |
| Standard Deviation (Population) | 6.1% | 7.4% |
Similar Demographics by Female Poverty Among 18-24 Year Olds
Demographics Similar to Immigrants from Haiti by Female Poverty Among 18-24 Year Olds
In terms of female poverty among 18-24 year olds, the demographic groups most similar to Immigrants from Haiti are Armenian (18.7%, a difference of 0.020%), Immigrants from Costa Rica (18.7%, a difference of 0.060%), Lithuanian (18.7%, a difference of 0.060%), Immigrants from Bulgaria (18.6%, a difference of 0.17%), and Hawaiian (18.7%, a difference of 0.24%).
| Demographics | Rating | Rank | Female Poverty Among 18-24 Year Olds |
| Immigrants | Asia | 99.8 /100 | #64 | Exceptional 18.6% |
| Immigrants | Scotland | 99.8 /100 | #65 | Exceptional 18.6% |
| Jordanians | 99.8 /100 | #66 | Exceptional 18.6% |
| Immigrants | Korea | 99.8 /100 | #67 | Exceptional 18.6% |
| Brazilians | 99.8 /100 | #68 | Exceptional 18.6% |
| Immigrants | Bulgaria | 99.7 /100 | #69 | Exceptional 18.6% |
| Immigrants | Costa Rica | 99.7 /100 | #70 | Exceptional 18.7% |
| Immigrants | Haiti | 99.7 /100 | #71 | Exceptional 18.7% |
| Armenians | 99.7 /100 | #72 | Exceptional 18.7% |
| Lithuanians | 99.7 /100 | #73 | Exceptional 18.7% |
| Hawaiians | 99.6 /100 | #74 | Exceptional 18.7% |
| Poles | 99.6 /100 | #75 | Exceptional 18.8% |
| Immigrants | Cambodia | 99.5 /100 | #76 | Exceptional 18.8% |
| Costa Ricans | 99.5 /100 | #77 | Exceptional 18.8% |
| Immigrants | Europe | 99.5 /100 | #78 | Exceptional 18.8% |
Demographics Similar to Immigrants from Dominican Republic by Female Poverty Among 18-24 Year Olds
In terms of female poverty among 18-24 year olds, the demographic groups most similar to Immigrants from Dominican Republic are Immigrants from Dominica (21.9%, a difference of 0.040%), Spanish American (21.9%, a difference of 0.050%), Bermudan (21.9%, a difference of 0.090%), Yaqui (21.9%, a difference of 0.22%), and Subsaharan African (22.0%, a difference of 0.39%).
| Demographics | Rating | Rank | Female Poverty Among 18-24 Year Olds |
| Immigrants | Honduras | 0.1 /100 | #274 | Tragic 21.8% |
| Immigrants | Bangladesh | 0.1 /100 | #275 | Tragic 21.8% |
| Bahamians | 0.1 /100 | #276 | Tragic 21.8% |
| Immigrants | Switzerland | 0.1 /100 | #277 | Tragic 21.8% |
| Yaqui | 0.1 /100 | #278 | Tragic 21.9% |
| Spanish Americans | 0.1 /100 | #279 | Tragic 21.9% |
| Immigrants | Dominica | 0.1 /100 | #280 | Tragic 21.9% |
| Immigrants | Dominican Republic | 0.1 /100 | #281 | Tragic 21.9% |
| Bermudans | 0.1 /100 | #282 | Tragic 21.9% |
| Sub-Saharan Africans | 0.0 /100 | #283 | Tragic 22.0% |
| Tlingit-Haida | 0.0 /100 | #284 | Tragic 22.0% |
| Ottawa | 0.0 /100 | #285 | Tragic 22.0% |
| Ugandans | 0.0 /100 | #286 | Tragic 22.1% |
| Immigrants | Middle Africa | 0.0 /100 | #287 | Tragic 22.1% |
| Dominicans | 0.0 /100 | #288 | Tragic 22.3% |