Immigrants from Guatemala vs Bahamian In Labor Force | Age 20-24
COMPARE
Immigrants from Guatemala
Bahamian
In Labor Force | Age 20-24
In Labor Force | Age 20-24 Comparison
Immigrants from Guatemala
Bahamians
75.3%
IN LABOR FORCE | AGE 20-24
71.9/ 100
METRIC RATING
155th/ 347
METRIC RANK
73.3%
IN LABOR FORCE | AGE 20-24
0.1/ 100
METRIC RATING
280th/ 347
METRIC RANK
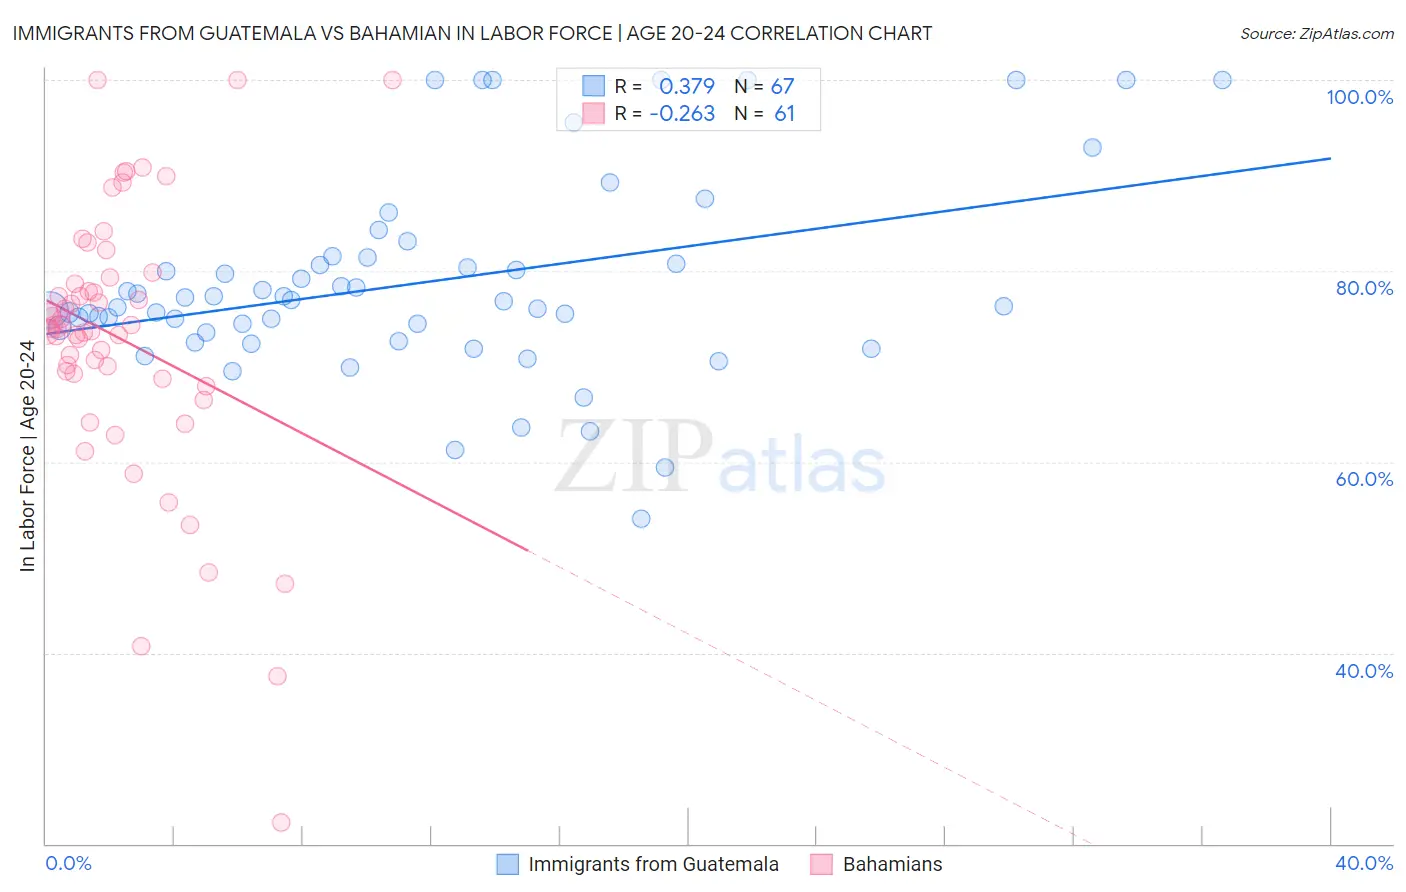
Immigrants from Guatemala vs Bahamian In Labor Force | Age 20-24 Correlation Chart
The statistical analysis conducted on geographies consisting of 377,197,138 people shows a mild positive correlation between the proportion of Immigrants from Guatemala and labor force participation rate among population between the ages 20 and 24 in the United States with a correlation coefficient (R) of 0.379 and weighted average of 75.3%. Similarly, the statistical analysis conducted on geographies consisting of 112,697,524 people shows a weak negative correlation between the proportion of Bahamians and labor force participation rate among population between the ages 20 and 24 in the United States with a correlation coefficient (R) of -0.263 and weighted average of 73.3%, a difference of 2.8%.
In Labor Force | Age 20-24 Correlation Summary
| Measurement | Immigrants from Guatemala | Bahamian |
| Minimum | 54.1% | 22.2% |
| Maximum | 100.0% | 100.0% |
| Range | 45.9% | 77.8% |
| Mean | 78.8% | 72.9% |
| Median | 76.8% | 74.0% |
| Interquartile 25% (IQ1) | 73.5% | 69.0% |
| Interquartile 75% (IQ3) | 81.5% | 79.0% |
| Interquartile Range (IQR) | 7.9% | 10.0% |
| Standard Deviation (Sample) | 10.4% | 14.3% |
| Standard Deviation (Population) | 10.3% | 14.1% |
Similar Demographics by In Labor Force | Age 20-24
Demographics Similar to Immigrants from Guatemala by In Labor Force | Age 20-24
In terms of in labor force | age 20-24, the demographic groups most similar to Immigrants from Guatemala are Immigrants from El Salvador (75.3%, a difference of 0.0%), Guatemalan (75.3%, a difference of 0.010%), Osage (75.3%, a difference of 0.010%), Immigrants from Western Europe (75.3%, a difference of 0.010%), and Immigrants from Bolivia (75.3%, a difference of 0.020%).
| Demographics | Rating | Rank | In Labor Force | Age 20-24 |
| Immigrants | Cambodia | 76.7 /100 | #148 | Good 75.4% |
| Ugandans | 76.1 /100 | #149 | Good 75.4% |
| Salvadorans | 74.8 /100 | #150 | Good 75.3% |
| Paiute | 74.1 /100 | #151 | Good 75.3% |
| Lebanese | 73.5 /100 | #152 | Good 75.3% |
| Guatemalans | 72.3 /100 | #153 | Good 75.3% |
| Osage | 72.3 /100 | #154 | Good 75.3% |
| Immigrants | Guatemala | 71.9 /100 | #155 | Good 75.3% |
| Immigrants | El Salvador | 71.7 /100 | #156 | Good 75.3% |
| Immigrants | Western Europe | 71.5 /100 | #157 | Good 75.3% |
| Immigrants | Bolivia | 71.0 /100 | #158 | Good 75.3% |
| South American Indians | 69.0 /100 | #159 | Good 75.3% |
| Japanese | 68.7 /100 | #160 | Good 75.3% |
| New Zealanders | 65.4 /100 | #161 | Good 75.2% |
| Immigrants | Romania | 64.6 /100 | #162 | Good 75.2% |
Demographics Similar to Bahamians by In Labor Force | Age 20-24
In terms of in labor force | age 20-24, the demographic groups most similar to Bahamians are Immigrants from Venezuela (73.2%, a difference of 0.030%), Immigrants from Spain (73.2%, a difference of 0.040%), Immigrants from Bahamas (73.2%, a difference of 0.050%), Venezuelan (73.3%, a difference of 0.070%), and Kiowa (73.2%, a difference of 0.070%).
| Demographics | Rating | Rank | In Labor Force | Age 20-24 |
| Cheyenne | 0.2 /100 | #273 | Tragic 73.4% |
| Immigrants | Colombia | 0.2 /100 | #274 | Tragic 73.4% |
| Immigrants | South America | 0.2 /100 | #275 | Tragic 73.3% |
| Mongolians | 0.2 /100 | #276 | Tragic 73.3% |
| Immigrants | Malaysia | 0.2 /100 | #277 | Tragic 73.3% |
| Cypriots | 0.2 /100 | #278 | Tragic 73.3% |
| Venezuelans | 0.2 /100 | #279 | Tragic 73.3% |
| Bahamians | 0.1 /100 | #280 | Tragic 73.3% |
| Immigrants | Venezuela | 0.1 /100 | #281 | Tragic 73.2% |
| Immigrants | Spain | 0.1 /100 | #282 | Tragic 73.2% |
| Immigrants | Bahamas | 0.1 /100 | #283 | Tragic 73.2% |
| Kiowa | 0.1 /100 | #284 | Tragic 73.2% |
| Nicaraguans | 0.1 /100 | #285 | Tragic 73.2% |
| Immigrants | Lebanon | 0.1 /100 | #286 | Tragic 73.1% |
| Immigrants | Korea | 0.1 /100 | #287 | Tragic 73.1% |