Immigrants from Grenada vs Slovak Disability Age 65 to 74
COMPARE
Immigrants from Grenada
Slovak
Disability Age 65 to 74
Disability Age 65 to 74 Comparison
Immigrants from Grenada
Slovaks
23.8%
DISABILITY AGE 65 TO 74
22.1/ 100
METRIC RATING
204th/ 347
METRIC RANK
22.5%
DISABILITY AGE 65 TO 74
91.6/ 100
METRIC RATING
127th/ 347
METRIC RANK
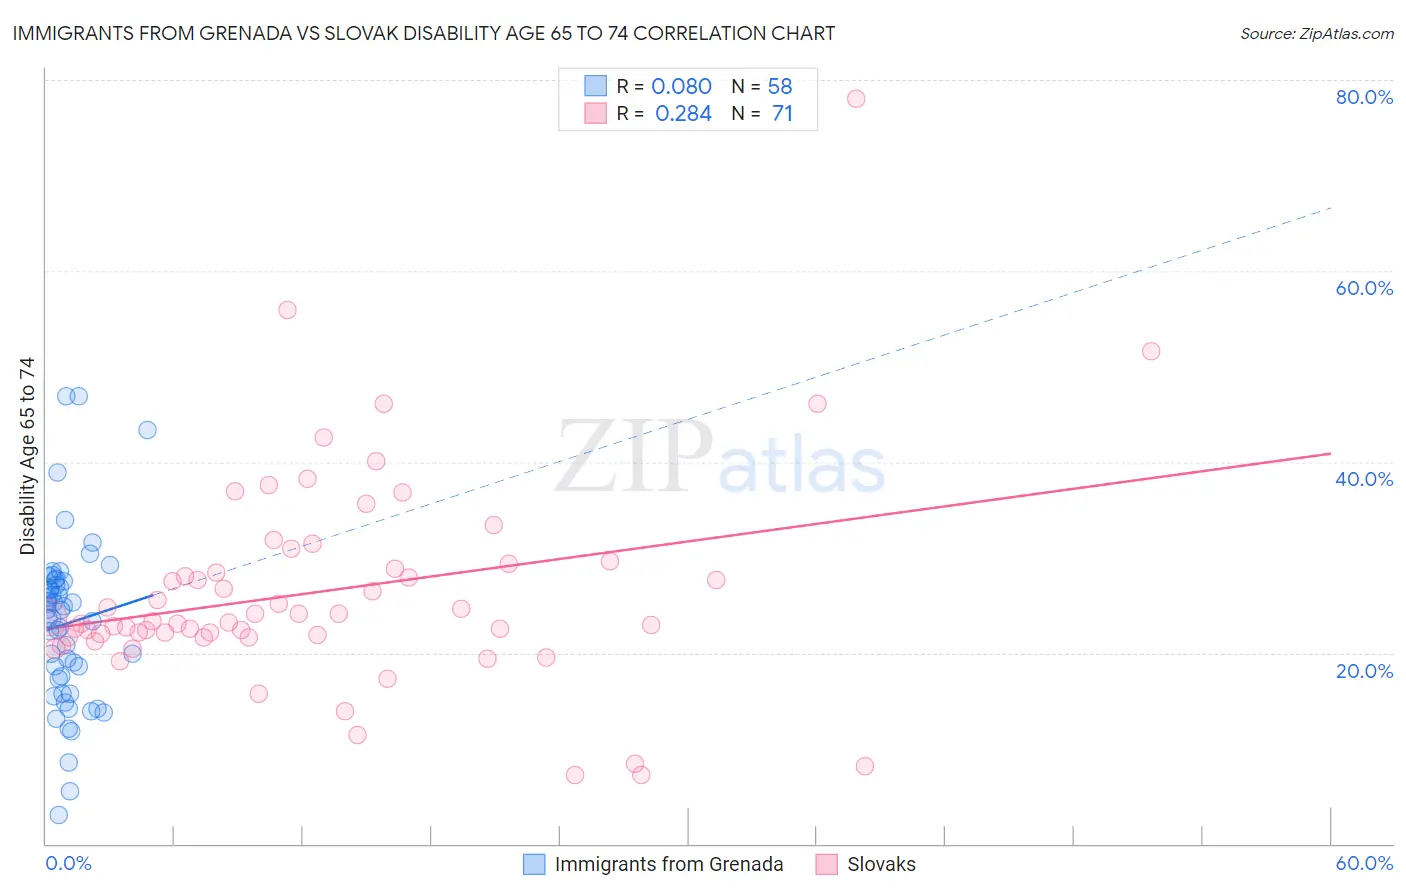
Immigrants from Grenada vs Slovak Disability Age 65 to 74 Correlation Chart
The statistical analysis conducted on geographies consisting of 67,159,466 people shows a slight positive correlation between the proportion of Immigrants from Grenada and percentage of population with a disability between the ages 65 and 75 in the United States with a correlation coefficient (R) of 0.080 and weighted average of 23.8%. Similarly, the statistical analysis conducted on geographies consisting of 397,207,671 people shows a weak positive correlation between the proportion of Slovaks and percentage of population with a disability between the ages 65 and 75 in the United States with a correlation coefficient (R) of 0.284 and weighted average of 22.5%, a difference of 5.5%.
Disability Age 65 to 74 Correlation Summary
| Measurement | Immigrants from Grenada | Slovak |
| Minimum | 3.0% | 7.1% |
| Maximum | 46.9% | 78.0% |
| Range | 43.9% | 70.9% |
| Mean | 23.1% | 26.4% |
| Median | 24.0% | 23.2% |
| Interquartile 25% (IQ1) | 17.2% | 21.6% |
| Interquartile 75% (IQ3) | 27.5% | 29.3% |
| Interquartile Range (IQR) | 10.2% | 7.7% |
| Standard Deviation (Sample) | 8.7% | 11.2% |
| Standard Deviation (Population) | 8.7% | 11.1% |
Similar Demographics by Disability Age 65 to 74
Demographics Similar to Immigrants from Grenada by Disability Age 65 to 74
In terms of disability age 65 to 74, the demographic groups most similar to Immigrants from Grenada are Kenyan (23.7%, a difference of 0.090%), Immigrants from Bahamas (23.7%, a difference of 0.11%), Tongan (23.8%, a difference of 0.11%), Immigrants from Jamaica (23.8%, a difference of 0.11%), and French Canadian (23.7%, a difference of 0.15%).
| Demographics | Rating | Rank | Disability Age 65 to 74 |
| Immigrants | Immigrants | 25.8 /100 | #197 | Fair 23.7% |
| Immigrants | Africa | 24.4 /100 | #198 | Fair 23.7% |
| Welsh | 24.3 /100 | #199 | Fair 23.7% |
| French Canadians | 24.0 /100 | #200 | Fair 23.7% |
| Immigrants | Ecuador | 23.9 /100 | #201 | Fair 23.7% |
| Immigrants | Bahamas | 23.3 /100 | #202 | Fair 23.7% |
| Kenyans | 23.2 /100 | #203 | Fair 23.7% |
| Immigrants | Grenada | 22.1 /100 | #204 | Fair 23.8% |
| Tongans | 20.8 /100 | #205 | Fair 23.8% |
| Immigrants | Jamaica | 20.7 /100 | #206 | Fair 23.8% |
| Immigrants | Sudan | 20.1 /100 | #207 | Fair 23.8% |
| Immigrants | Barbados | 19.6 /100 | #208 | Poor 23.8% |
| Immigrants | Kenya | 19.6 /100 | #209 | Poor 23.8% |
| Trinidadians and Tobagonians | 16.4 /100 | #210 | Poor 23.9% |
| Immigrants | West Indies | 15.9 /100 | #211 | Poor 23.9% |
Demographics Similar to Slovaks by Disability Age 65 to 74
In terms of disability age 65 to 74, the demographic groups most similar to Slovaks are Lebanese (22.5%, a difference of 0.11%), Immigrants from Western Europe (22.5%, a difference of 0.13%), Norwegian (22.5%, a difference of 0.17%), Immigrants from Costa Rica (22.6%, a difference of 0.23%), and Immigrants from Uruguay (22.6%, a difference of 0.29%).
| Demographics | Rating | Rank | Disability Age 65 to 74 |
| Immigrants | Kazakhstan | 93.9 /100 | #120 | Exceptional 22.4% |
| Czechs | 93.5 /100 | #121 | Exceptional 22.4% |
| Immigrants | Jordan | 93.5 /100 | #122 | Exceptional 22.4% |
| Hungarians | 93.3 /100 | #123 | Exceptional 22.4% |
| Norwegians | 92.5 /100 | #124 | Exceptional 22.5% |
| Immigrants | Western Europe | 92.3 /100 | #125 | Exceptional 22.5% |
| Lebanese | 92.2 /100 | #126 | Exceptional 22.5% |
| Slovaks | 91.6 /100 | #127 | Exceptional 22.5% |
| Immigrants | Costa Rica | 90.4 /100 | #128 | Exceptional 22.6% |
| Immigrants | Uruguay | 90.1 /100 | #129 | Exceptional 22.6% |
| Immigrants | Albania | 90.0 /100 | #130 | Excellent 22.6% |
| Immigrants | Nepal | 89.4 /100 | #131 | Excellent 22.6% |
| Costa Ricans | 89.2 /100 | #132 | Excellent 22.6% |
| Northern Europeans | 88.9 /100 | #133 | Excellent 22.6% |
| Afghans | 88.6 /100 | #134 | Excellent 22.6% |