Immigrants from Grenada vs Honduran Disability Age 35 to 64

COMPARE

Immigrants from Grenada
Race
Ancestry
AfghanAfricanAlaska NativeAlaskan AthabascanAlbanianAleutAlsatianAmericanApacheArabArapahoArgentineanArmenianAssyrian/Chaldean/SyriacAustralianAustrianBahamianBangladeshiBarbadianBasqueBelgianBelizeanBermudanBhutaneseBlackfeetBolivianBrazilianBritishBritish West IndianBulgarianBurmeseCajunCambodianCanadianCape VerdeanCarpatho RusynCelticCentral AmericanCentral American IndianCherokeeCheyenneChickasawChileanChineseChippewaChoctawColombianColvilleComancheCosta RicanCreeCreekCroatianCrowCubanCypriotCzechCzechoslovakianDanishDelawareDominicanDutchDutch West IndianEastern EuropeanEcuadorianEgyptianEnglishEstonianEthiopianEuropeanFijianFilipinoFinnishFrenchFrench American IndianFrench CanadianGermanGerman RussianGhanaianGreekGuamanian/ChamorroGuatemalanGuyaneseHaitianHmongHopiHoumaHungarianIcelanderIndian (Asian)IndonesianInupiatIranianIraqiIrishIroquoisIsraeliItalianJamaicanJapaneseJordanianKenyanKiowaKoreanLaotianLatvianLebaneseLiberianLithuanianLumbeeLuxembourgerMacedonianMalaysianMalteseMarshalleseMenomineeMexicanMexican American IndianMongolianMoroccanNative HawaiianNavajoNepaleseNew ZealanderNicaraguanNigerianNorthern EuropeanNorwegianOkinawanOsageOttawaPaiutePakistaniPalestinianPanamanianParaguayanPennsylvania GermanPeruvianPimaPolishPortuguesePotawatomiPuebloPuerto RicanPuget Sound SalishRomanianRussianSalvadoranSamoanScandinavianScotch-IrishScottishSeminoleSenegaleseSerbianShoshoneSierra LeoneanSiouxSlavicSlovakSloveneSomaliSouth AfricanSouth AmericanSouth American IndianSoviet UnionSpaniardSpanishSpanish AmericanSpanish American IndianSri LankanSubsaharan AfricanSudaneseSwedishSwissSyrianTaiwaneseThaiTlingit-HaidaTohono O'OdhamTonganTrinidadian and TobagonianTsimshianTurkishU.S. Virgin IslanderUgandanUkrainianUruguayanUteVenezuelanVietnameseWelshWest IndianYakamaYaquiYugoslavianYumanYup'ikZimbabwean
Immigration
NonimmigrantsImmigrantsAfghanistanAfricaAlbaniaArgentinaArmeniaAsiaAustraliaAustriaBahamasBangladeshBarbadosBelarusBelgiumBelizeBoliviaBosnia and HerzegovinaBrazilBulgariaBurma/MyanmarCabo VerdeCambodiaCameroonCanadaCaribbeanCentral AmericaChileChinaColombiaCongoCosta RicaCroatiaCubaCzechoslovakiaDenmarkDominicaDominican RepublicEastern AfricaEastern AsiaEastern EuropeEcuadorEgyptEl SalvadorEnglandEritreaEthiopiaEuropeFijiFranceGermanyGhanaGreeceGrenadaGuatemalaGuyanaHaitiHondurasHong KongHungaryIndiaIndonesiaIranIraqIrelandIsraelItalyJamaicaJapanJordanKazakhstanKenyaKoreaKuwaitLaosLatin AmericaLatviaLebanonLiberiaLithuaniaMalaysiaMexicoMicronesiaMiddle AfricaMoldovaMoroccoNepalNetherlandsNicaraguaNigeriaNorth AmericaNorth MacedoniaNorthern AfricaNorthern EuropeNorwayOceaniaPakistanPanamaPeruPhilippinesPolandPortugalRomaniaRussiaSaudi ArabiaScotlandSenegalSerbiaSierra LeoneSingaporeSomaliaSouth AfricaSouth AmericaSouth Central AsiaSouth Eastern AsiaSouthern EuropeSpainSri LankaSt. Vincent and the GrenadinesSudanSwedenSwitzerlandSyriaTaiwanThailandTrinidad and TobagoTurkeyUgandaUkraineUruguayUzbekistanVenezuelaVietnamWest IndiesWestern AfricaWestern AsiaWestern EuropeYemenZaireZimbabweAzores
Honduran
Race
Ancestry
AfghanAfricanAlaska NativeAlaskan AthabascanAlbanianAleutAlsatianAmericanApacheArabArapahoArgentineanArmenianAssyrian/Chaldean/SyriacAustralianAustrianBahamianBangladeshiBarbadianBasqueBelgianBelizeanBermudanBhutaneseBlackfeetBolivianBrazilianBritishBritish West IndianBulgarianBurmeseCajunCambodianCanadianCape VerdeanCarpatho RusynCelticCentral AmericanCentral American IndianCherokeeCheyenneChickasawChileanChineseChippewaChoctawColombianColvilleComancheCosta RicanCreeCreekCroatianCrowCubanCypriotCzechCzechoslovakianDanishDelawareDominicanDutchDutch West IndianEastern EuropeanEcuadorianEgyptianEnglishEstonianEthiopianEuropeanFijianFilipinoFinnishFrenchFrench American IndianFrench CanadianGermanGerman RussianGhanaianGreekGuamanian/ChamorroGuatemalanGuyaneseHaitianHmongHonduranHopiHoumaHungarianIcelanderIndian (Asian)IndonesianInupiatIranianIraqiIrishIroquoisIsraeliItalianJamaicanJapaneseJordanianKenyanKiowaKoreanLaotianLatvianLebaneseLiberianLithuanianLumbeeLuxembourgerMacedonianMalaysianMalteseMarshalleseMenomineeMexicanMexican American IndianMongolianMoroccanNative HawaiianNavajoNepaleseNew ZealanderNicaraguanNigerianNorthern EuropeanNorwegianOkinawanOsageOttawaPaiutePakistaniPalestinianPanamanianParaguayanPennsylvania GermanPeruvianPimaPolishPortuguesePotawatomiPuebloPuerto RicanPuget Sound SalishRomanianRussianSalvadoranSamoanScandinavianScotch-IrishScottishSeminoleSenegaleseSerbianShoshoneSierra LeoneanSiouxSlavicSlovakSloveneSomaliSouth AfricanSouth AmericanSouth American IndianSoviet UnionSpaniardSpanishSpanish AmericanSpanish American IndianSri LankanSubsaharan AfricanSudaneseSwedishSwissSyrianTaiwaneseThaiTlingit-HaidaTohono O'OdhamTonganTrinidadian and TobagonianTsimshianTurkishU.S. Virgin IslanderUgandanUkrainianUruguayanUteVenezuelanVietnameseWelshWest IndianYakamaYaquiYugoslavianYumanYup'ikZimbabwean
Immigration
NonimmigrantsImmigrantsAfghanistanAfricaAlbaniaArgentinaArmeniaAsiaAustraliaAustriaBahamasBangladeshBarbadosBelarusBelgiumBelizeBoliviaBosnia and HerzegovinaBrazilBulgariaBurma/MyanmarCabo VerdeCambodiaCameroonCanadaCaribbeanCentral AmericaChileChinaColombiaCongoCosta RicaCroatiaCubaCzechoslovakiaDenmarkDominicaDominican RepublicEastern AfricaEastern AsiaEastern EuropeEcuadorEgyptEl SalvadorEnglandEritreaEthiopiaEuropeFijiFranceGermanyGhanaGreeceGuatemalaGuyanaHaitiHondurasHong KongHungaryIndiaIndonesiaIranIraqIrelandIsraelItalyJamaicaJapanJordanKazakhstanKenyaKoreaKuwaitLaosLatin AmericaLatviaLebanonLiberiaLithuaniaMalaysiaMexicoMicronesiaMiddle AfricaMoldovaMoroccoNepalNetherlandsNicaraguaNigeriaNorth AmericaNorth MacedoniaNorthern AfricaNorthern EuropeNorwayOceaniaPakistanPanamaPeruPhilippinesPolandPortugalRomaniaRussiaSaudi ArabiaScotlandSenegalSerbiaSierra LeoneSingaporeSomaliaSouth AfricaSouth AmericaSouth Central AsiaSouth Eastern AsiaSouthern EuropeSpainSri LankaSt. Vincent and the GrenadinesSudanSwedenSwitzerlandSyriaTaiwanThailandTrinidad and TobagoTurkeyUgandaUkraineUruguayUzbekistanVenezuelaVietnamWest IndiesWestern AfricaWestern AsiaWestern EuropeYemenZaireZimbabweAzores
Disability Age 35 to 64
Income
Poverty
Unemployment
Labor Participation
Family Structure
Vehicle Availability
Education Level
Disability

Disability Age 35 to 64 Comparison

Immigrants from Grenada

Hondurans

Good
Tragic
11.1%
DISABILITY AGE 35 TO 64
68.4/ 100
METRIC RATING
162nd/ 347
METRIC RANK
11.8%
DISABILITY AGE 35 TO 64
8.4/ 100
METRIC RATING
222nd/ 347
METRIC RANK

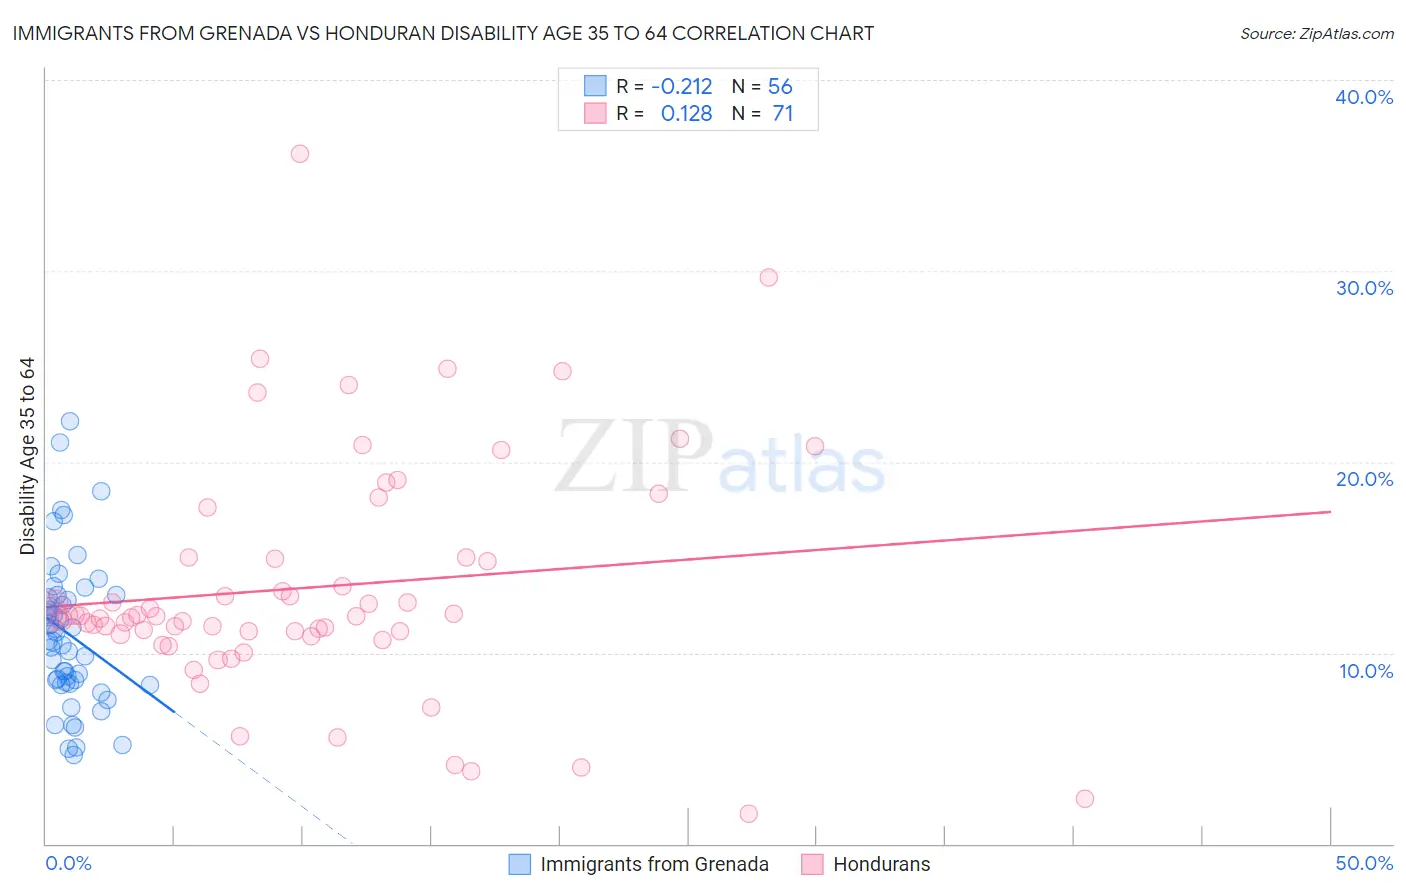
Immigrants from Grenada vs Honduran Disability Age 35 to 64 Correlation Chart

The statistical analysis conducted on geographies consisting of 67,181,423 people shows a weak negative correlation between the proportion of Immigrants from Grenada and percentage of population with a disability between the ages 34 and 64 in the United States with a correlation coefficient (R) of -0.212 and weighted average of 11.1%. Similarly, the statistical analysis conducted on geographies consisting of 357,560,855 people shows a poor positive correlation between the proportion of Hondurans and percentage of population with a disability between the ages 34 and 64 in the United States with a correlation coefficient (R) of 0.128 and weighted average of 11.8%, a difference of 6.4%.
Immigrants from Grenada vs Honduran Disability Age 35 to 64

Disability Age 35 to 64 Correlation Summary

MeasurementImmigrants from GrenadaHonduran
Minimum4.6%1.6%
Maximum22.2%36.1%
Range17.5%34.5%
Mean11.0%13.4%
Median10.6%11.9%
Interquartile 25% (IQ1)8.4%11.0%
Interquartile 75% (IQ3)12.9%15.0%
Interquartile Range (IQR)4.5%4.0%
Standard Deviation (Sample)3.9%6.2%
Standard Deviation (Population)3.8%6.1%

Similar Demographics by Disability Age 35 to 64

Demographics Similar to Immigrants from Grenada by Disability Age 35 to 64

In terms of disability age 35 to 64, the demographic groups most similar to Immigrants from Grenada are Immigrants from St. Vincent and the Grenadines (11.1%, a difference of 0.16%), Immigrants from Guyana (11.1%, a difference of 0.17%), Pakistani (11.1%, a difference of 0.24%), Immigrants from Western Europe (11.1%, a difference of 0.29%), and Immigrants from Haiti (11.1%, a difference of 0.41%).
DemographicsRating | RankDisability Age 35 to 64
Moroccans
76.4
/100
|
#155
Good
11.0%
Immigrants | Sierra Leone
76.2
/100
|
#156
Good
11.0%
Guyanese
75.1
/100
|
#157
Good
11.0%
Immigrants | North America
74.9
/100
|
#158
Good
11.0%
Serbians
73.6
/100
|
#159
Good
11.0%
Croatians
73.1
/100
|
#160
Good
11.0%
Immigrants | Guyana
70.1
/100
|
#161
Good
11.1%
Immigrants | Grenada
68.4
/100
|
#162
Good
11.1%
Immigrants | St. Vincent and the Grenadines
66.6
/100
|
#163
Good
11.1%
Pakistanis
65.8
/100
|
#164
Good
11.1%
Immigrants | Western Europe
65.2
/100
|
#165
Good
11.1%
Immigrants | Haiti
63.8
/100
|
#166
Good
11.1%
Austrians
63.2
/100
|
#167
Good
11.1%
Central Americans
59.1
/100
|
#168
Average
11.2%
Haitians
59.0
/100
|
#169
Average
11.2%

Demographics Similar to Hondurans by Disability Age 35 to 64

In terms of disability age 35 to 64, the demographic groups most similar to Hondurans are Immigrants from Honduras (11.8%, a difference of 0.0%), Alsatian (11.8%, a difference of 0.020%), Immigrants from West Indies (11.8%, a difference of 0.10%), Czechoslovakian (11.8%, a difference of 0.15%), and Immigrants from Ghana (11.8%, a difference of 0.15%).
DemographicsRating | RankDisability Age 35 to 64
Spanish American Indians
11.1
/100
|
#215
Poor
11.7%
Bahamians
10.7
/100
|
#216
Poor
11.8%
Barbadians
9.5
/100
|
#217
Tragic
11.8%
Immigrants | Bahamas
9.2
/100
|
#218
Tragic
11.8%
Czechoslovakians
9.0
/100
|
#219
Tragic
11.8%
Immigrants | West Indies
8.9
/100
|
#220
Tragic
11.8%
Alsatians
8.5
/100
|
#221
Tragic
11.8%
Hondurans
8.4
/100
|
#222
Tragic
11.8%
Immigrants | Honduras
8.4
/100
|
#223
Tragic
11.8%
Immigrants | Ghana
7.8
/100
|
#224
Tragic
11.8%
Immigrants | Belize
6.6
/100
|
#225
Tragic
11.9%
Scandinavians
6.4
/100
|
#226
Tragic
11.9%
Immigrants | Central America
6.3
/100
|
#227
Tragic
11.9%
Immigrants | Germany
6.2
/100
|
#228
Tragic
11.9%
British West Indians
6.1
/100
|
#229
Tragic
11.9%