Immigrants from Greece vs Immigrants from Taiwan Householder Income Over 65 years
COMPARE
Immigrants from Greece
Immigrants from Taiwan
Householder Income Over 65 years
Householder Income Over 65 years Comparison
Immigrants from Greece
Immigrants from Taiwan
$64,636
HOUSEHOLDER INCOME OVER 65 YEARS
97.9/ 100
METRIC RATING
84th/ 347
METRIC RANK
$77,051
HOUSEHOLDER INCOME OVER 65 YEARS
100.0/ 100
METRIC RATING
3rd/ 347
METRIC RANK
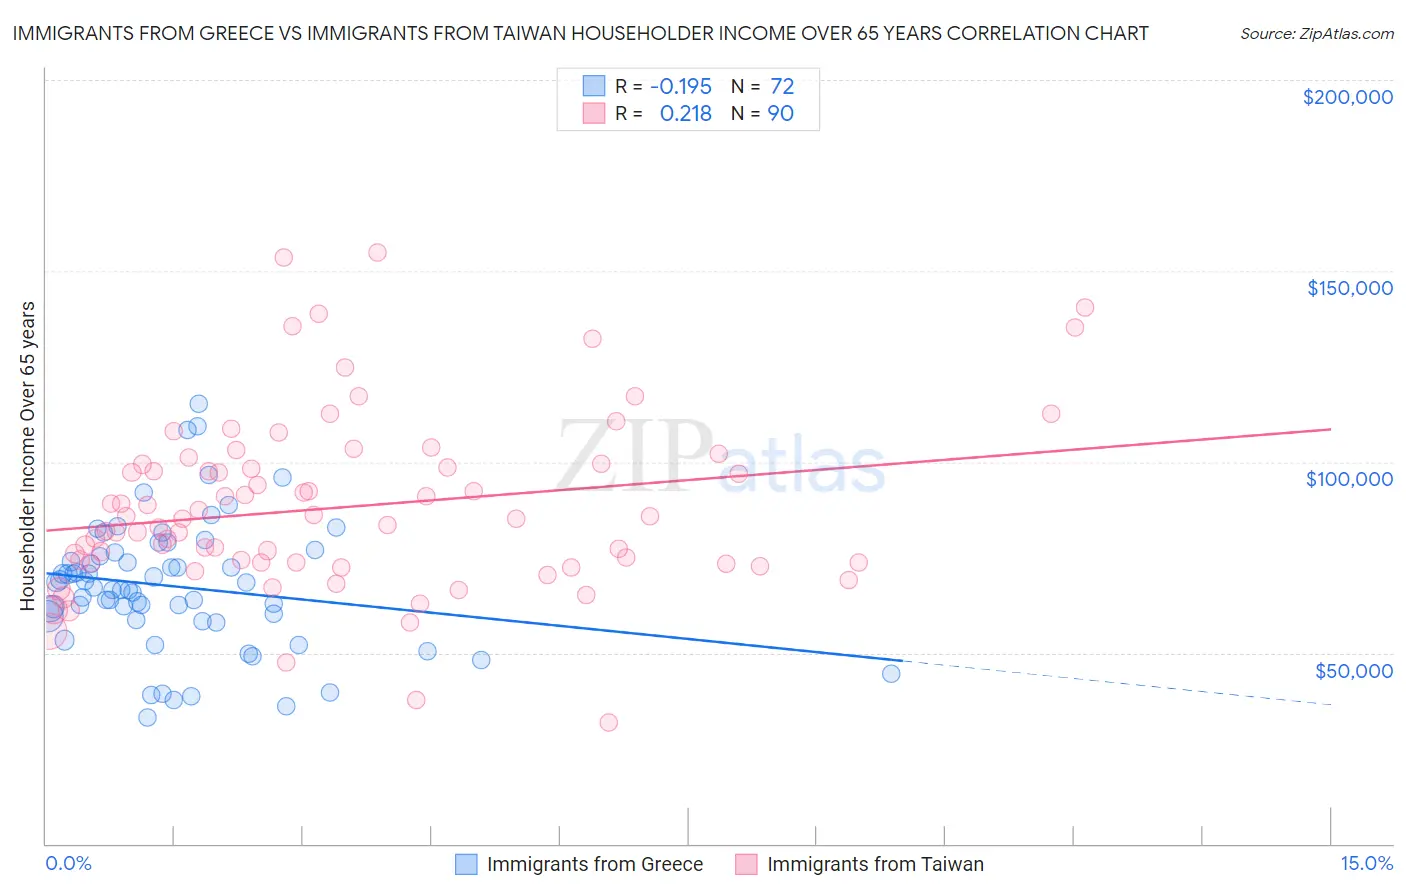
Immigrants from Greece vs Immigrants from Taiwan Householder Income Over 65 years Correlation Chart
The statistical analysis conducted on geographies consisting of 216,676,886 people shows a poor negative correlation between the proportion of Immigrants from Greece and household income with householder over the age of 65 in the United States with a correlation coefficient (R) of -0.195 and weighted average of $64,636. Similarly, the statistical analysis conducted on geographies consisting of 297,705,032 people shows a weak positive correlation between the proportion of Immigrants from Taiwan and household income with householder over the age of 65 in the United States with a correlation coefficient (R) of 0.218 and weighted average of $77,051, a difference of 19.2%.
Householder Income Over 65 years Correlation Summary
| Measurement | Immigrants from Greece | Immigrants from Taiwan |
| Minimum | $33,062 | $31,867 |
| Maximum | $115,263 | $154,709 |
| Range | $82,200 | $122,842 |
| Mean | $67,357 | $88,175 |
| Median | $66,928 | $85,060 |
| Interquartile 25% (IQ1) | $58,960 | $73,583 |
| Interquartile 75% (IQ3) | $75,732 | $99,353 |
| Interquartile Range (IQR) | $16,773 | $25,770 |
| Standard Deviation (Sample) | $16,859 | $23,073 |
| Standard Deviation (Population) | $16,741 | $22,945 |
Similar Demographics by Householder Income Over 65 years
Demographics Similar to Immigrants from Greece by Householder Income Over 65 years
In terms of householder income over 65 years, the demographic groups most similar to Immigrants from Greece are Northern European ($64,658, a difference of 0.030%), Immigrants from Lebanon ($64,521, a difference of 0.18%), Immigrants from Russia ($64,512, a difference of 0.19%), Immigrants from Fiji ($64,795, a difference of 0.25%), and Austrian ($64,470, a difference of 0.26%).
| Demographics | Rating | Rank | Householder Income Over 65 years |
| Immigrants | Canada | 98.5 /100 | #77 | Exceptional $64,952 |
| Immigrants | Western Europe | 98.5 /100 | #78 | Exceptional $64,933 |
| Hawaiians | 98.4 /100 | #79 | Exceptional $64,920 |
| Immigrants | North America | 98.3 /100 | #80 | Exceptional $64,856 |
| Immigrants | Europe | 98.3 /100 | #81 | Exceptional $64,828 |
| Immigrants | Fiji | 98.2 /100 | #82 | Exceptional $64,795 |
| Northern Europeans | 97.9 /100 | #83 | Exceptional $64,658 |
| Immigrants | Greece | 97.9 /100 | #84 | Exceptional $64,636 |
| Immigrants | Lebanon | 97.6 /100 | #85 | Exceptional $64,521 |
| Immigrants | Russia | 97.6 /100 | #86 | Exceptional $64,512 |
| Austrians | 97.5 /100 | #87 | Exceptional $64,470 |
| Immigrants | Romania | 97.5 /100 | #88 | Exceptional $64,462 |
| Paraguayans | 97.4 /100 | #89 | Exceptional $64,443 |
| Immigrants | Kuwait | 97.4 /100 | #90 | Exceptional $64,433 |
| Immigrants | Oceania | 97.4 /100 | #91 | Exceptional $64,416 |
Demographics Similar to Immigrants from Taiwan by Householder Income Over 65 years
In terms of householder income over 65 years, the demographic groups most similar to Immigrants from Taiwan are Filipino ($76,686, a difference of 0.48%), Iranian ($77,429, a difference of 0.49%), Chinese ($77,465, a difference of 0.54%), Immigrants from Iran ($75,081, a difference of 2.6%), and Bolivian ($74,245, a difference of 3.8%).
| Demographics | Rating | Rank | Householder Income Over 65 years |
| Chinese | 100.0 /100 | #1 | Exceptional $77,465 |
| Iranians | 100.0 /100 | #2 | Exceptional $77,429 |
| Immigrants | Taiwan | 100.0 /100 | #3 | Exceptional $77,051 |
| Filipinos | 100.0 /100 | #4 | Exceptional $76,686 |
| Immigrants | Iran | 100.0 /100 | #5 | Exceptional $75,081 |
| Bolivians | 100.0 /100 | #6 | Exceptional $74,245 |
| Immigrants | Bolivia | 100.0 /100 | #7 | Exceptional $73,434 |
| Immigrants | Singapore | 100.0 /100 | #8 | Exceptional $72,963 |
| Immigrants | India | 100.0 /100 | #9 | Exceptional $72,804 |
| Bhutanese | 100.0 /100 | #10 | Exceptional $72,288 |
| Thais | 100.0 /100 | #11 | Exceptional $72,099 |
| Cypriots | 100.0 /100 | #12 | Exceptional $71,714 |
| Immigrants | Hong Kong | 100.0 /100 | #13 | Exceptional $71,567 |
| Burmese | 100.0 /100 | #14 | Exceptional $71,139 |
| Native Hawaiians | 100.0 /100 | #15 | Exceptional $71,021 |