Immigrants from Ghana vs Immigrants from Iraq Unemployment Among Ages 20 to 24 years
COMPARE
Immigrants from Ghana
Immigrants from Iraq
Unemployment Among Ages 20 to 24 years
Unemployment Among Ages 20 to 24 years Comparison
Immigrants from Ghana
Immigrants from Iraq
11.9%
UNEMPLOYMENT AMONG AGES 20 TO 24 YEARS
0.0/ 100
METRIC RATING
293rd/ 347
METRIC RANK
10.1%
UNEMPLOYMENT AMONG AGES 20 TO 24 YEARS
87.1/ 100
METRIC RATING
123rd/ 347
METRIC RANK
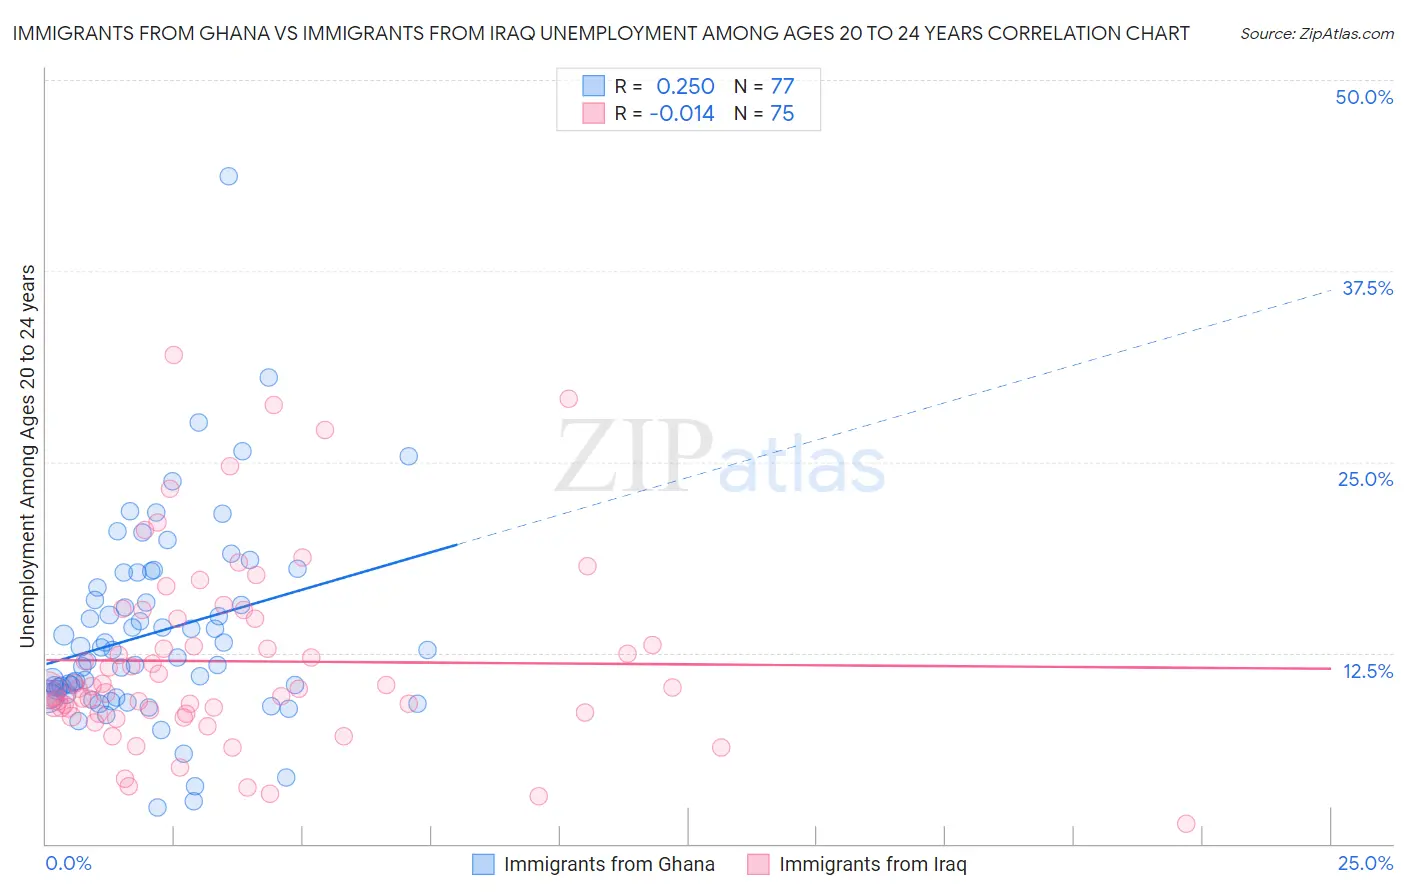
Immigrants from Ghana vs Immigrants from Iraq Unemployment Among Ages 20 to 24 years Correlation Chart
The statistical analysis conducted on geographies consisting of 197,571,933 people shows a weak positive correlation between the proportion of Immigrants from Ghana and unemployment rate among population between the ages 20 and 24 in the United States with a correlation coefficient (R) of 0.250 and weighted average of 11.9%. Similarly, the statistical analysis conducted on geographies consisting of 192,460,138 people shows no correlation between the proportion of Immigrants from Iraq and unemployment rate among population between the ages 20 and 24 in the United States with a correlation coefficient (R) of -0.014 and weighted average of 10.1%, a difference of 18.0%.
Unemployment Among Ages 20 to 24 years Correlation Summary
| Measurement | Immigrants from Ghana | Immigrants from Iraq |
| Minimum | 2.4% | 1.3% |
| Maximum | 43.7% | 32.0% |
| Range | 41.3% | 30.7% |
| Mean | 13.9% | 11.9% |
| Median | 12.7% | 10.2% |
| Interquartile 25% (IQ1) | 9.7% | 8.5% |
| Interquartile 75% (IQ3) | 17.3% | 14.7% |
| Interquartile Range (IQR) | 7.5% | 6.2% |
| Standard Deviation (Sample) | 6.5% | 6.2% |
| Standard Deviation (Population) | 6.5% | 6.1% |
Similar Demographics by Unemployment Among Ages 20 to 24 years
Demographics Similar to Immigrants from Ghana by Unemployment Among Ages 20 to 24 years
In terms of unemployment among ages 20 to 24 years, the demographic groups most similar to Immigrants from Ghana are Immigrants from Belize (12.0%, a difference of 0.030%), Immigrants from Armenia (12.0%, a difference of 0.21%), Immigrants from Senegal (11.9%, a difference of 0.23%), Cajun (12.0%, a difference of 0.24%), and Blackfeet (12.0%, a difference of 0.25%).
| Demographics | Rating | Rank | Unemployment Among Ages 20 to 24 years |
| Ecuadorians | 0.0 /100 | #286 | Tragic 11.8% |
| Immigrants | Ecuador | 0.0 /100 | #287 | Tragic 11.8% |
| U.S. Virgin Islanders | 0.0 /100 | #288 | Tragic 11.8% |
| Belizeans | 0.0 /100 | #289 | Tragic 11.8% |
| Immigrants | Caribbean | 0.0 /100 | #290 | Tragic 11.8% |
| Central American Indians | 0.0 /100 | #291 | Tragic 11.9% |
| Immigrants | Senegal | 0.0 /100 | #292 | Tragic 11.9% |
| Immigrants | Ghana | 0.0 /100 | #293 | Tragic 11.9% |
| Immigrants | Belize | 0.0 /100 | #294 | Tragic 12.0% |
| Immigrants | Armenia | 0.0 /100 | #295 | Tragic 12.0% |
| Cajuns | 0.0 /100 | #296 | Tragic 12.0% |
| Blackfeet | 0.0 /100 | #297 | Tragic 12.0% |
| Lumbee | 0.0 /100 | #298 | Tragic 12.0% |
| Apache | 0.0 /100 | #299 | Tragic 12.0% |
| Spanish American Indians | 0.0 /100 | #300 | Tragic 12.1% |
Demographics Similar to Immigrants from Iraq by Unemployment Among Ages 20 to 24 years
In terms of unemployment among ages 20 to 24 years, the demographic groups most similar to Immigrants from Iraq are White/Caucasian (10.1%, a difference of 0.020%), Immigrants from Japan (10.1%, a difference of 0.050%), South African (10.1%, a difference of 0.060%), Spanish (10.1%, a difference of 0.080%), and Jordanian (10.1%, a difference of 0.080%).
| Demographics | Rating | Rank | Unemployment Among Ages 20 to 24 years |
| Basques | 89.8 /100 | #116 | Excellent 10.1% |
| Immigrants | Uruguay | 89.6 /100 | #117 | Excellent 10.1% |
| Paraguayans | 88.6 /100 | #118 | Excellent 10.1% |
| French | 88.2 /100 | #119 | Excellent 10.1% |
| Immigrants | Canada | 88.2 /100 | #120 | Excellent 10.1% |
| South Africans | 87.8 /100 | #121 | Excellent 10.1% |
| Whites/Caucasians | 87.4 /100 | #122 | Excellent 10.1% |
| Immigrants | Iraq | 87.1 /100 | #123 | Excellent 10.1% |
| Immigrants | Japan | 86.5 /100 | #124 | Excellent 10.1% |
| Spanish | 86.1 /100 | #125 | Excellent 10.1% |
| Jordanians | 86.1 /100 | #126 | Excellent 10.1% |
| Immigrants | Norway | 85.3 /100 | #127 | Excellent 10.1% |
| Immigrants | Brazil | 84.9 /100 | #128 | Excellent 10.1% |
| Immigrants | South Central Asia | 84.6 /100 | #129 | Excellent 10.1% |
| Immigrants | Lithuania | 84.2 /100 | #130 | Excellent 10.1% |