Immigrants from Ghana vs Immigrants from Lithuania Householder Income Over 65 years
COMPARE
Immigrants from Ghana
Immigrants from Lithuania
Householder Income Over 65 years
Householder Income Over 65 years Comparison
Immigrants from Ghana
Immigrants from Lithuania
$58,624
HOUSEHOLDER INCOME OVER 65 YEARS
7.9/ 100
METRIC RATING
215th/ 347
METRIC RANK
$66,087
HOUSEHOLDER INCOME OVER 65 YEARS
99.5/ 100
METRIC RATING
60th/ 347
METRIC RANK
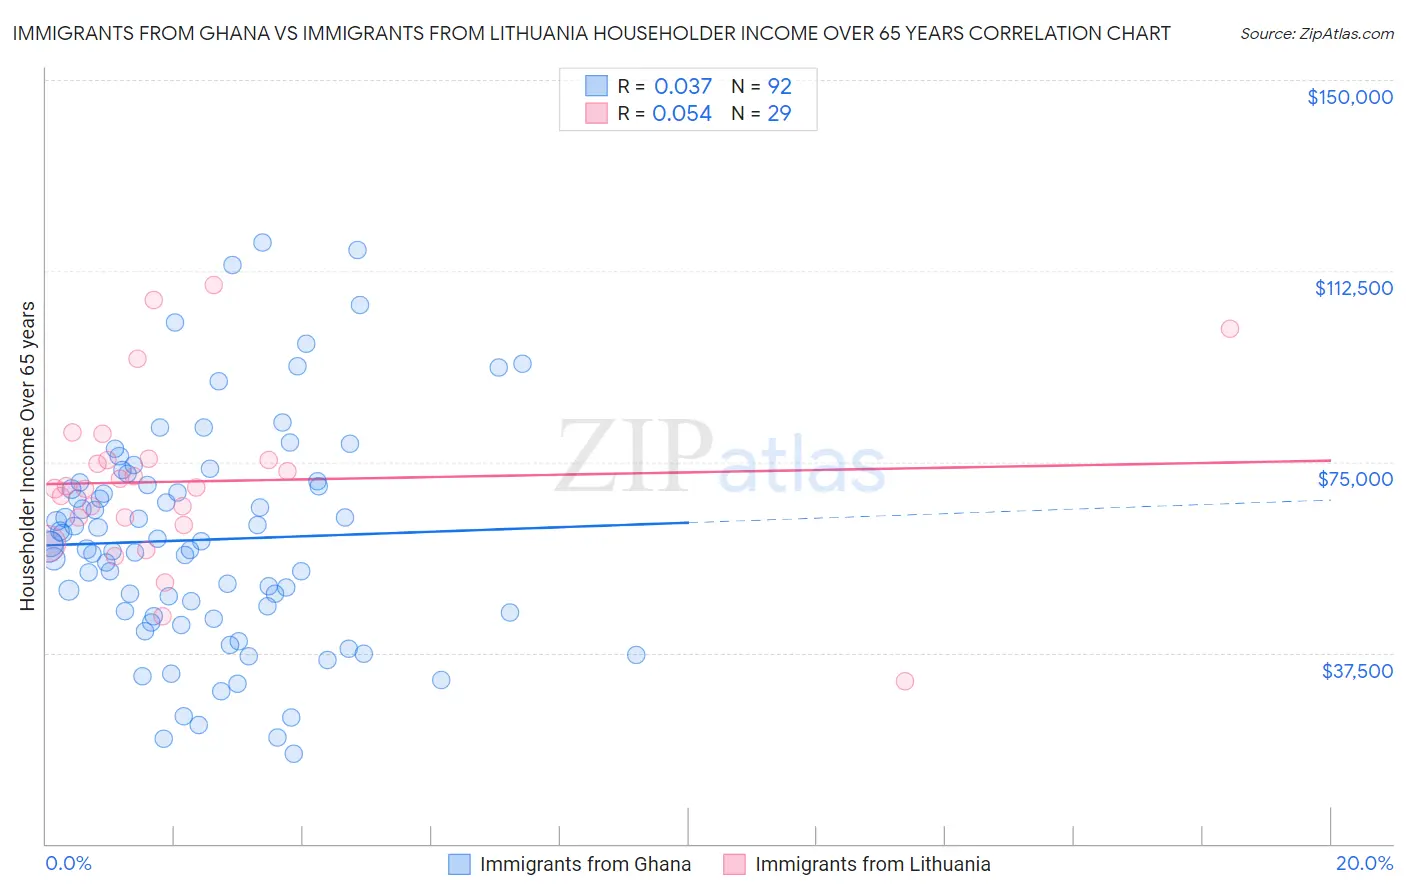
Immigrants from Ghana vs Immigrants from Lithuania Householder Income Over 65 years Correlation Chart
The statistical analysis conducted on geographies consisting of 199,306,105 people shows no correlation between the proportion of Immigrants from Ghana and household income with householder over the age of 65 in the United States with a correlation coefficient (R) of 0.037 and weighted average of $58,624. Similarly, the statistical analysis conducted on geographies consisting of 117,674,239 people shows a slight positive correlation between the proportion of Immigrants from Lithuania and household income with householder over the age of 65 in the United States with a correlation coefficient (R) of 0.054 and weighted average of $66,087, a difference of 12.7%.
Householder Income Over 65 years Correlation Summary
| Measurement | Immigrants from Ghana | Immigrants from Lithuania |
| Minimum | $17,788 | $31,875 |
| Maximum | $118,015 | $109,815 |
| Range | $100,227 | $77,940 |
| Mean | $59,709 | $71,191 |
| Median | $58,613 | $69,876 |
| Interquartile 25% (IQ1) | $45,151 | $63,362 |
| Interquartile 75% (IQ3) | $70,697 | $75,497 |
| Interquartile Range (IQR) | $25,546 | $12,135 |
| Standard Deviation (Sample) | $21,702 | $16,809 |
| Standard Deviation (Population) | $21,584 | $16,517 |
Similar Demographics by Householder Income Over 65 years
Demographics Similar to Immigrants from Ghana by Householder Income Over 65 years
In terms of householder income over 65 years, the demographic groups most similar to Immigrants from Ghana are Nepalese ($58,761, a difference of 0.23%), White/Caucasian ($58,847, a difference of 0.38%), Colombian ($58,851, a difference of 0.39%), Immigrants from Middle Africa ($58,375, a difference of 0.43%), and Immigrants from Nigeria ($58,942, a difference of 0.54%).
| Demographics | Rating | Rank | Householder Income Over 65 years |
| Uruguayans | 12.3 /100 | #208 | Poor $59,090 |
| Slovaks | 11.7 /100 | #209 | Poor $59,039 |
| Nigerians | 11.2 /100 | #210 | Poor $58,992 |
| Immigrants | Nigeria | 10.7 /100 | #211 | Poor $58,942 |
| Colombians | 9.8 /100 | #212 | Tragic $58,851 |
| Whites/Caucasians | 9.8 /100 | #213 | Tragic $58,847 |
| Nepalese | 9.0 /100 | #214 | Tragic $58,761 |
| Immigrants | Ghana | 7.9 /100 | #215 | Tragic $58,624 |
| Immigrants | Middle Africa | 6.2 /100 | #216 | Tragic $58,375 |
| Sudanese | 5.7 /100 | #217 | Tragic $58,281 |
| Panamanians | 5.6 /100 | #218 | Tragic $58,266 |
| Malaysians | 5.5 /100 | #219 | Tragic $58,244 |
| Yugoslavians | 5.5 /100 | #220 | Tragic $58,243 |
| Immigrants | El Salvador | 5.4 /100 | #221 | Tragic $58,226 |
| Delaware | 5.3 /100 | #222 | Tragic $58,214 |
Demographics Similar to Immigrants from Lithuania by Householder Income Over 65 years
In terms of householder income over 65 years, the demographic groups most similar to Immigrants from Lithuania are Immigrants from Norway ($66,118, a difference of 0.050%), Maltese ($66,027, a difference of 0.090%), Immigrants from Philippines ($66,161, a difference of 0.11%), Immigrants from Sierra Leone ($66,009, a difference of 0.12%), and Bulgarian ($66,236, a difference of 0.22%).
| Demographics | Rating | Rank | Householder Income Over 65 years |
| Immigrants | Pakistan | 99.7 /100 | #53 | Exceptional $66,617 |
| Immigrants | Netherlands | 99.7 /100 | #54 | Exceptional $66,463 |
| Immigrants | Czechoslovakia | 99.7 /100 | #55 | Exceptional $66,376 |
| Laotians | 99.6 /100 | #56 | Exceptional $66,306 |
| Bulgarians | 99.6 /100 | #57 | Exceptional $66,236 |
| Immigrants | Philippines | 99.6 /100 | #58 | Exceptional $66,161 |
| Immigrants | Norway | 99.5 /100 | #59 | Exceptional $66,118 |
| Immigrants | Lithuania | 99.5 /100 | #60 | Exceptional $66,087 |
| Maltese | 99.5 /100 | #61 | Exceptional $66,027 |
| Immigrants | Sierra Leone | 99.5 /100 | #62 | Exceptional $66,009 |
| Marshallese | 99.4 /100 | #63 | Exceptional $65,874 |
| Zimbabweans | 99.4 /100 | #64 | Exceptional $65,854 |
| Immigrants | England | 99.3 /100 | #65 | Exceptional $65,715 |
| South Africans | 99.3 /100 | #66 | Exceptional $65,652 |
| Immigrants | Malaysia | 99.1 /100 | #67 | Exceptional $65,497 |