Immigrants from France vs Immigrants from Somalia In Labor Force | Age 20-64
COMPARE
Immigrants from France
Immigrants from Somalia
In Labor Force | Age 20-64
In Labor Force | Age 20-64 Comparison
Immigrants from France
Immigrants from Somalia
79.9%
IN LABOR FORCE | AGE 20-64
90.7/ 100
METRIC RATING
126th/ 347
METRIC RANK
81.6%
IN LABOR FORCE | AGE 20-64
100.0/ 100
METRIC RATING
8th/ 347
METRIC RANK
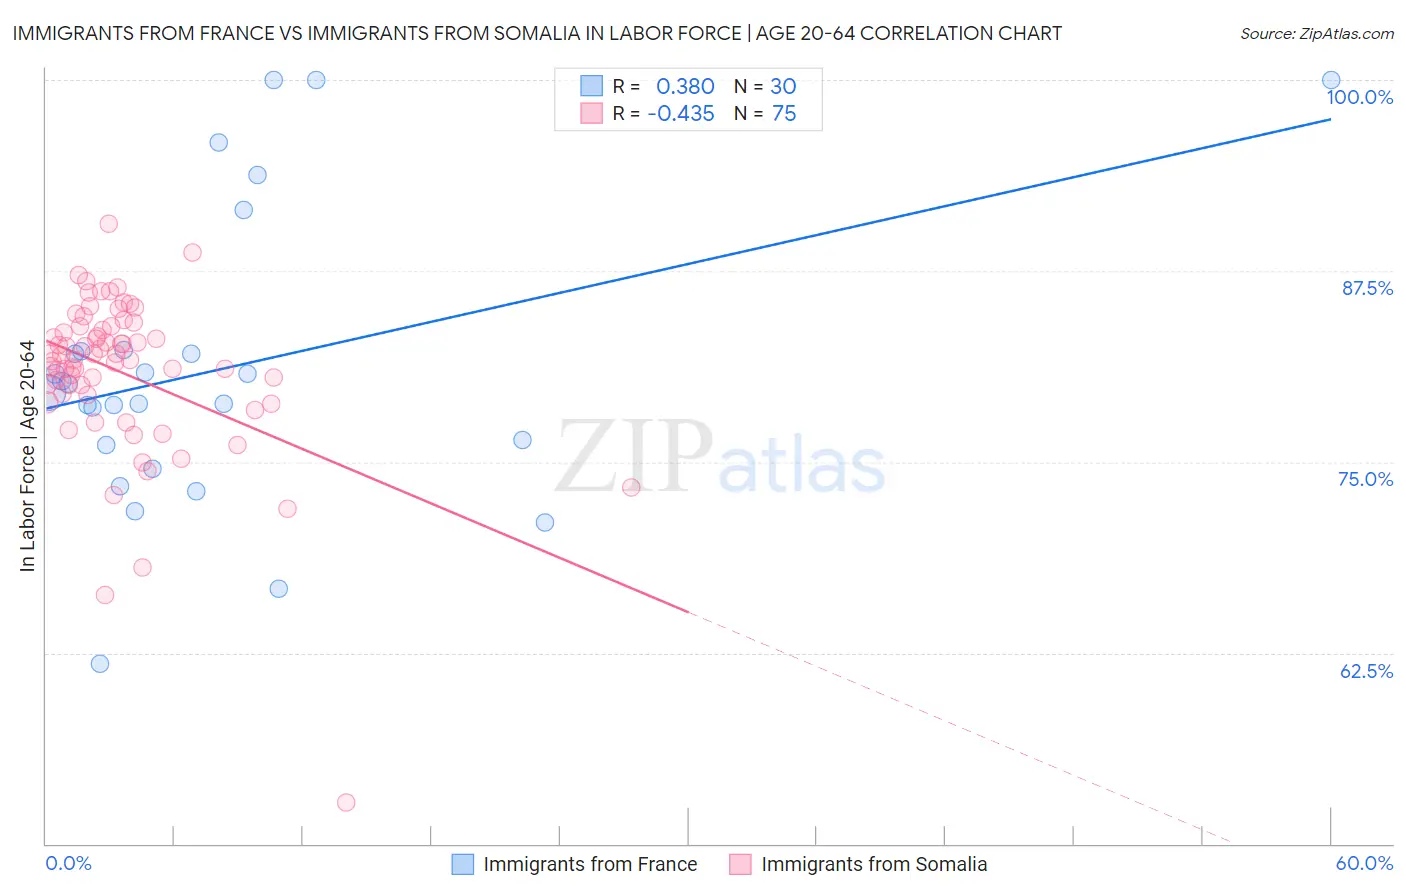
Immigrants from France vs Immigrants from Somalia In Labor Force | Age 20-64 Correlation Chart
The statistical analysis conducted on geographies consisting of 287,921,180 people shows a mild positive correlation between the proportion of Immigrants from France and labor force participation rate among population between the ages 20 and 64 in the United States with a correlation coefficient (R) of 0.380 and weighted average of 79.9%. Similarly, the statistical analysis conducted on geographies consisting of 92,107,842 people shows a moderate negative correlation between the proportion of Immigrants from Somalia and labor force participation rate among population between the ages 20 and 64 in the United States with a correlation coefficient (R) of -0.435 and weighted average of 81.6%, a difference of 2.0%.
In Labor Force | Age 20-64 Correlation Summary
| Measurement | Immigrants from France | Immigrants from Somalia |
| Minimum | 61.8% | 52.7% |
| Maximum | 100.0% | 90.6% |
| Range | 38.2% | 37.9% |
| Mean | 81.0% | 80.8% |
| Median | 79.8% | 81.7% |
| Interquartile 25% (IQ1) | 76.1% | 79.4% |
| Interquartile 75% (IQ3) | 82.3% | 83.9% |
| Interquartile Range (IQR) | 6.2% | 4.4% |
| Standard Deviation (Sample) | 9.4% | 5.4% |
| Standard Deviation (Population) | 9.3% | 5.4% |
Similar Demographics by In Labor Force | Age 20-64
Demographics Similar to Immigrants from France by In Labor Force | Age 20-64
In terms of in labor force | age 20-64, the demographic groups most similar to Immigrants from France are Immigrants from Europe (79.9%, a difference of 0.020%), Danish (79.9%, a difference of 0.020%), Immigrants from Czechoslovakia (79.9%, a difference of 0.020%), Mongolian (79.9%, a difference of 0.030%), and Immigrants from Russia (79.9%, a difference of 0.030%).
| Demographics | Rating | Rank | In Labor Force | Age 20-64 |
| Immigrants | Taiwan | 92.5 /100 | #119 | Exceptional 80.0% |
| Maltese | 92.4 /100 | #120 | Exceptional 80.0% |
| Immigrants | Kuwait | 92.2 /100 | #121 | Exceptional 80.0% |
| Mongolians | 92.0 /100 | #122 | Exceptional 79.9% |
| Immigrants | Russia | 91.8 /100 | #123 | Exceptional 79.9% |
| Immigrants | Europe | 91.6 /100 | #124 | Exceptional 79.9% |
| Danes | 91.5 /100 | #125 | Exceptional 79.9% |
| Immigrants | France | 90.7 /100 | #126 | Exceptional 79.9% |
| Immigrants | Czechoslovakia | 89.7 /100 | #127 | Excellent 79.9% |
| Immigrants | Eastern Asia | 89.4 /100 | #128 | Excellent 79.9% |
| Italians | 88.9 /100 | #129 | Excellent 79.9% |
| Immigrants | Zaire | 88.6 /100 | #130 | Excellent 79.9% |
| Immigrants | Iran | 88.3 /100 | #131 | Excellent 79.9% |
| Indians (Asian) | 87.7 /100 | #132 | Excellent 79.9% |
| South American Indians | 87.6 /100 | #133 | Excellent 79.9% |
Demographics Similar to Immigrants from Somalia by In Labor Force | Age 20-64
In terms of in labor force | age 20-64, the demographic groups most similar to Immigrants from Somalia are Sierra Leonean (81.5%, a difference of 0.0%), Immigrants from Cameroon (81.6%, a difference of 0.020%), Somali (81.6%, a difference of 0.060%), Immigrants from Sierra Leone (81.5%, a difference of 0.12%), and Bolivian (81.7%, a difference of 0.17%).
| Demographics | Rating | Rank | In Labor Force | Age 20-64 |
| Immigrants | Ethiopia | 100.0 /100 | #1 | Exceptional 82.1% |
| Ethiopians | 100.0 /100 | #2 | Exceptional 82.0% |
| Immigrants | Bolivia | 100.0 /100 | #3 | Exceptional 81.9% |
| Luxembourgers | 100.0 /100 | #4 | Exceptional 81.9% |
| Bolivians | 100.0 /100 | #5 | Exceptional 81.7% |
| Somalis | 100.0 /100 | #6 | Exceptional 81.6% |
| Immigrants | Cameroon | 100.0 /100 | #7 | Exceptional 81.6% |
| Immigrants | Somalia | 100.0 /100 | #8 | Exceptional 81.6% |
| Sierra Leoneans | 100.0 /100 | #9 | Exceptional 81.5% |
| Immigrants | Sierra Leone | 100.0 /100 | #10 | Exceptional 81.5% |
| Immigrants | Eastern Africa | 100.0 /100 | #11 | Exceptional 81.3% |
| Immigrants | Eritrea | 100.0 /100 | #12 | Exceptional 81.3% |
| Immigrants | India | 100.0 /100 | #13 | Exceptional 81.3% |
| Cambodians | 100.0 /100 | #14 | Exceptional 81.1% |
| Bulgarians | 100.0 /100 | #15 | Exceptional 81.1% |