Immigrants from Fiji vs Immigrants from Cuba Kindergarten
COMPARE
Immigrants from Fiji
Immigrants from Cuba
Kindergarten
Kindergarten Comparison
Immigrants from Fiji
Immigrants from Cuba
96.5%
KINDERGARTEN
0.0/ 100
METRIC RATING
338th/ 347
METRIC RANK
97.1%
KINDERGARTEN
0.0/ 100
METRIC RATING
299th/ 347
METRIC RANK
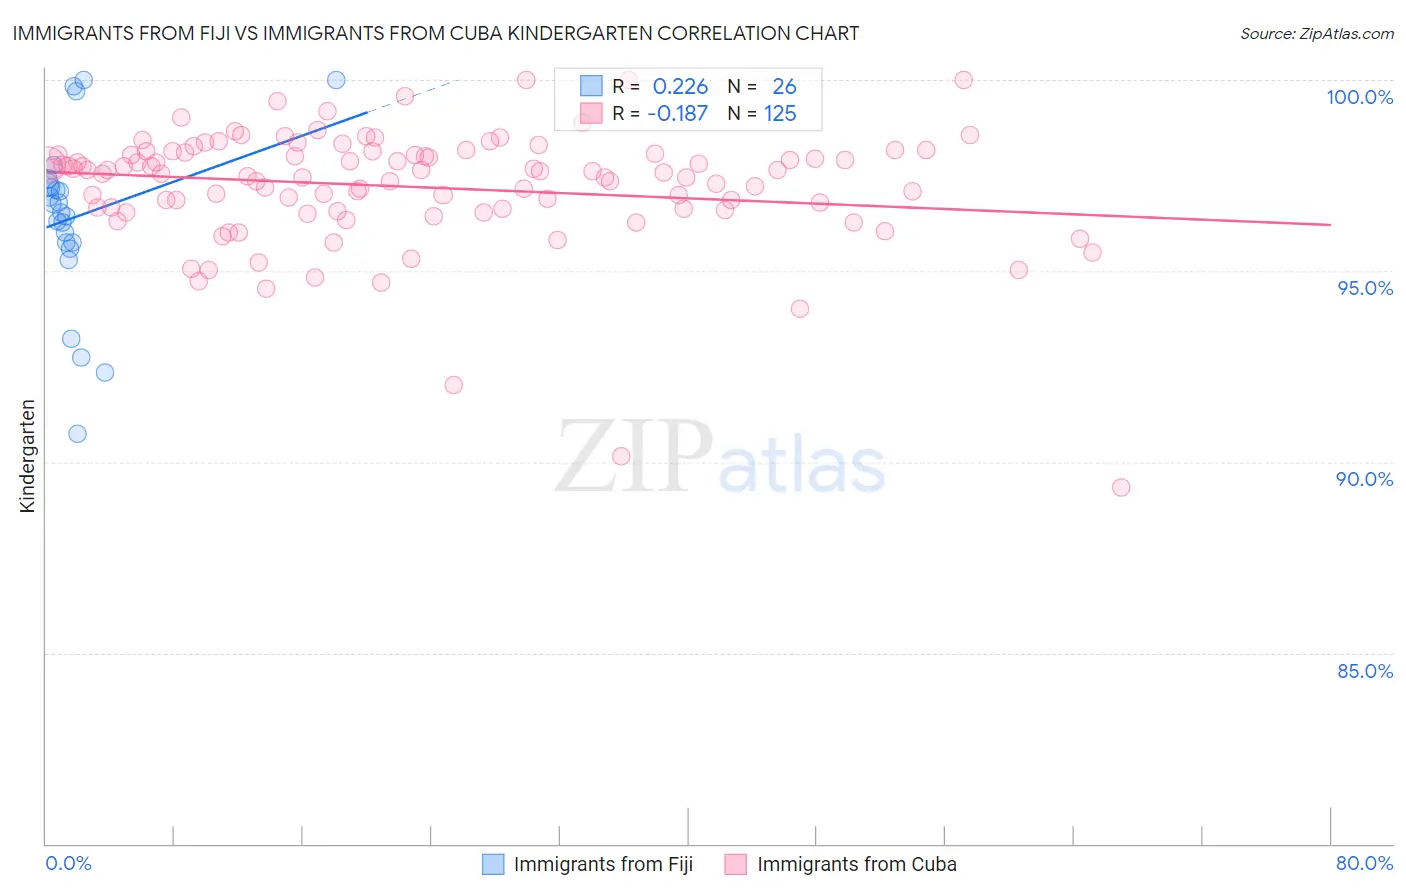
Immigrants from Fiji vs Immigrants from Cuba Kindergarten Correlation Chart
The statistical analysis conducted on geographies consisting of 93,756,204 people shows a weak positive correlation between the proportion of Immigrants from Fiji and percentage of population with at least kindergarten education in the United States with a correlation coefficient (R) of 0.226 and weighted average of 96.5%. Similarly, the statistical analysis conducted on geographies consisting of 326,028,159 people shows a poor negative correlation between the proportion of Immigrants from Cuba and percentage of population with at least kindergarten education in the United States with a correlation coefficient (R) of -0.187 and weighted average of 97.1%, a difference of 0.67%.
Kindergarten Correlation Summary
| Measurement | Immigrants from Fiji | Immigrants from Cuba |
| Minimum | 90.8% | 89.3% |
| Maximum | 100.0% | 100.0% |
| Range | 9.2% | 10.7% |
| Mean | 96.4% | 97.2% |
| Median | 96.6% | 97.6% |
| Interquartile 25% (IQ1) | 95.7% | 96.6% |
| Interquartile 75% (IQ3) | 97.2% | 98.1% |
| Interquartile Range (IQR) | 1.5% | 1.5% |
| Standard Deviation (Sample) | 2.3% | 1.6% |
| Standard Deviation (Population) | 2.2% | 1.6% |
Similar Demographics by Kindergarten
Demographics Similar to Immigrants from Fiji by Kindergarten
In terms of kindergarten, the demographic groups most similar to Immigrants from Fiji are Immigrants from Cambodia (96.5%, a difference of 0.010%), Guatemalan (96.5%, a difference of 0.050%), Immigrants from Dominican Republic (96.6%, a difference of 0.080%), Bangladeshi (96.6%, a difference of 0.080%), and Immigrants from Guatemala (96.4%, a difference of 0.080%).
| Demographics | Rating | Rank | Kindergarten |
| Immigrants | Armenia | 0.0 /100 | #331 | Tragic 96.6% |
| Yakama | 0.0 /100 | #332 | Tragic 96.6% |
| Central Americans | 0.0 /100 | #333 | Tragic 96.6% |
| Immigrants | Dominican Republic | 0.0 /100 | #334 | Tragic 96.6% |
| Bangladeshis | 0.0 /100 | #335 | Tragic 96.6% |
| Guatemalans | 0.0 /100 | #336 | Tragic 96.5% |
| Immigrants | Cambodia | 0.0 /100 | #337 | Tragic 96.5% |
| Immigrants | Fiji | 0.0 /100 | #338 | Tragic 96.5% |
| Immigrants | Guatemala | 0.0 /100 | #339 | Tragic 96.4% |
| Immigrants | Central America | 0.0 /100 | #340 | Tragic 96.4% |
| Immigrants | Cabo Verde | 0.0 /100 | #341 | Tragic 96.4% |
| Immigrants | Mexico | 0.0 /100 | #342 | Tragic 96.4% |
| Salvadorans | 0.0 /100 | #343 | Tragic 96.3% |
| Nepalese | 0.0 /100 | #344 | Tragic 96.2% |
| Immigrants | El Salvador | 0.0 /100 | #345 | Tragic 96.2% |
Demographics Similar to Immigrants from Cuba by Kindergarten
In terms of kindergarten, the demographic groups most similar to Immigrants from Cuba are Immigrants from Dominica (97.1%, a difference of 0.010%), Haitian (97.1%, a difference of 0.010%), Central American Indian (97.2%, a difference of 0.030%), Immigrants from South Eastern Asia (97.1%, a difference of 0.030%), and Immigrants from Caribbean (97.1%, a difference of 0.060%).
| Demographics | Rating | Rank | Kindergarten |
| British West Indians | 0.0 /100 | #292 | Tragic 97.3% |
| Malaysians | 0.0 /100 | #293 | Tragic 97.2% |
| Immigrants | Immigrants | 0.0 /100 | #294 | Tragic 97.2% |
| Immigrants | Grenada | 0.0 /100 | #295 | Tragic 97.2% |
| Immigrants | Eritrea | 0.0 /100 | #296 | Tragic 97.2% |
| Central American Indians | 0.0 /100 | #297 | Tragic 97.2% |
| Immigrants | Dominica | 0.0 /100 | #298 | Tragic 97.1% |
| Immigrants | Cuba | 0.0 /100 | #299 | Tragic 97.1% |
| Haitians | 0.0 /100 | #300 | Tragic 97.1% |
| Immigrants | South Eastern Asia | 0.0 /100 | #301 | Tragic 97.1% |
| Immigrants | Caribbean | 0.0 /100 | #302 | Tragic 97.1% |
| Somalis | 0.0 /100 | #303 | Tragic 97.0% |
| Nicaraguans | 0.0 /100 | #304 | Tragic 97.0% |
| Ecuadorians | 0.0 /100 | #305 | Tragic 97.0% |
| Belizeans | 0.0 /100 | #306 | Tragic 97.0% |