Immigrants from Fiji vs Czech Householder Income Ages 25 - 44 years
COMPARE
Immigrants from Fiji
Czech
Householder Income Ages 25 - 44 years
Householder Income Ages 25 - 44 years Comparison
Immigrants from Fiji
Czechs
$103,954
HOUSEHOLDER INCOME AGES 25 - 44 YEARS
99.5/ 100
METRIC RATING
74th/ 347
METRIC RANK
$96,525
HOUSEHOLDER INCOME AGES 25 - 44 YEARS
74.8/ 100
METRIC RATING
151st/ 347
METRIC RANK
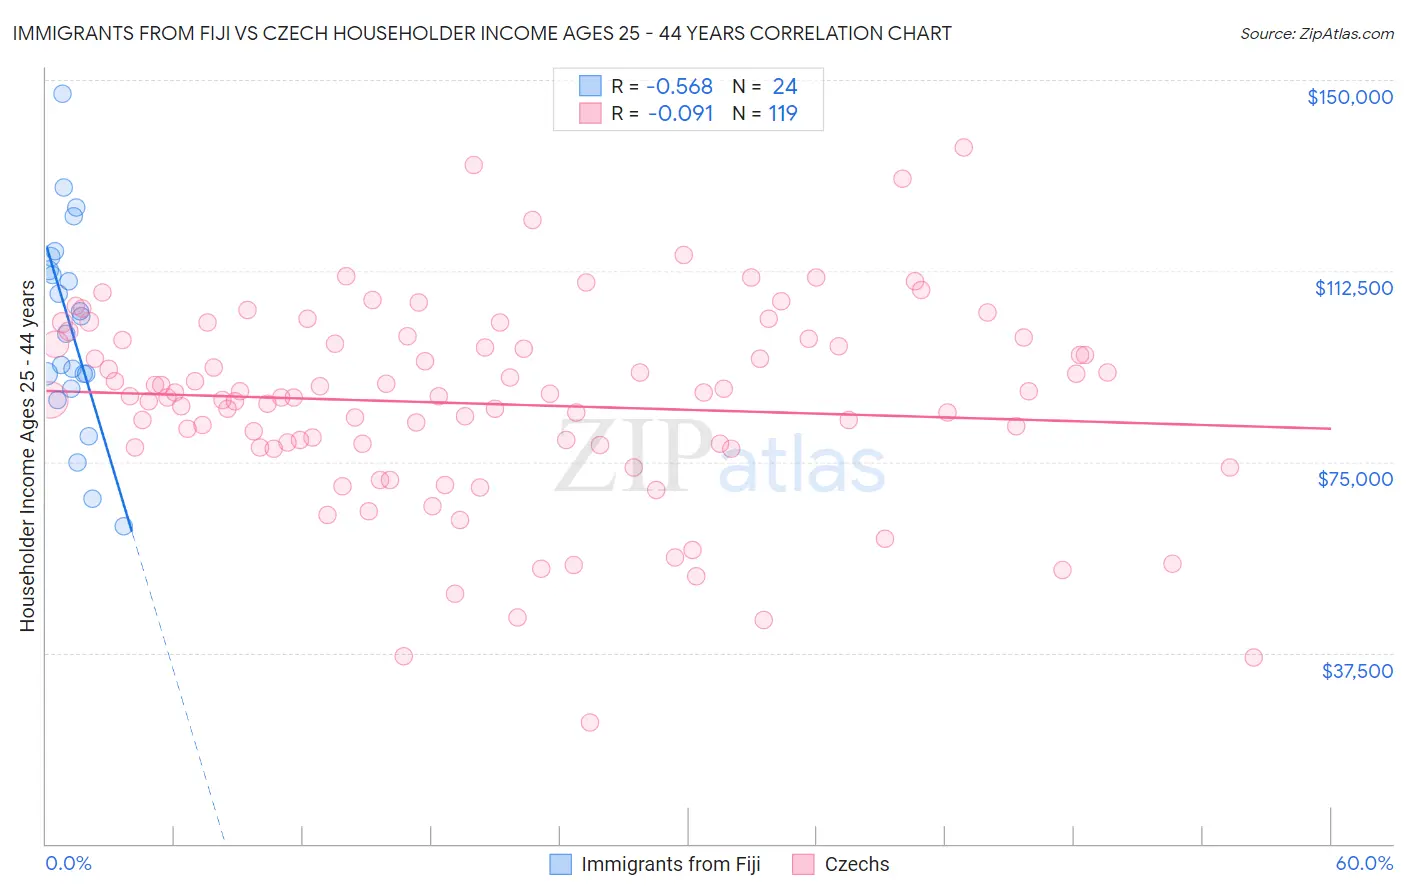
Immigrants from Fiji vs Czech Householder Income Ages 25 - 44 years Correlation Chart
The statistical analysis conducted on geographies consisting of 93,741,539 people shows a substantial negative correlation between the proportion of Immigrants from Fiji and household income with householder between the ages 25 and 44 in the United States with a correlation coefficient (R) of -0.568 and weighted average of $103,954. Similarly, the statistical analysis conducted on geographies consisting of 482,514,709 people shows a slight negative correlation between the proportion of Czechs and household income with householder between the ages 25 and 44 in the United States with a correlation coefficient (R) of -0.091 and weighted average of $96,525, a difference of 7.7%.
Householder Income Ages 25 - 44 years Correlation Summary
| Measurement | Immigrants from Fiji | Czech |
| Minimum | $62,417 | $23,929 |
| Maximum | $147,220 | $136,755 |
| Range | $84,803 | $112,826 |
| Mean | $101,378 | $86,343 |
| Median | $101,962 | $87,904 |
| Interquartile 25% (IQ1) | $90,849 | $77,941 |
| Interquartile 75% (IQ3) | $113,947 | $99,022 |
| Interquartile Range (IQR) | $23,098 | $21,080 |
| Standard Deviation (Sample) | $20,004 | $19,593 |
| Standard Deviation (Population) | $19,583 | $19,511 |
Similar Demographics by Householder Income Ages 25 - 44 years
Demographics Similar to Immigrants from Fiji by Householder Income Ages 25 - 44 years
In terms of householder income ages 25 - 44 years, the demographic groups most similar to Immigrants from Fiji are Korean ($103,824, a difference of 0.13%), Immigrants from Spain ($103,752, a difference of 0.19%), Italian ($104,215, a difference of 0.25%), Chinese ($104,264, a difference of 0.30%), and Afghan ($104,410, a difference of 0.44%).
| Demographics | Rating | Rank | Householder Income Ages 25 - 44 years |
| Immigrants | Romania | 99.6 /100 | #67 | Exceptional $104,713 |
| Immigrants | Eastern Europe | 99.6 /100 | #68 | Exceptional $104,662 |
| Mongolians | 99.6 /100 | #69 | Exceptional $104,578 |
| Immigrants | Croatia | 99.6 /100 | #70 | Exceptional $104,503 |
| Afghans | 99.6 /100 | #71 | Exceptional $104,410 |
| Chinese | 99.5 /100 | #72 | Exceptional $104,264 |
| Italians | 99.5 /100 | #73 | Exceptional $104,215 |
| Immigrants | Fiji | 99.5 /100 | #74 | Exceptional $103,954 |
| Koreans | 99.4 /100 | #75 | Exceptional $103,824 |
| Immigrants | Spain | 99.4 /100 | #76 | Exceptional $103,752 |
| Immigrants | Southern Europe | 99.3 /100 | #77 | Exceptional $103,486 |
| Immigrants | Bulgaria | 99.3 /100 | #78 | Exceptional $103,423 |
| Armenians | 99.2 /100 | #79 | Exceptional $103,248 |
| Immigrants | Egypt | 99.2 /100 | #80 | Exceptional $103,192 |
| South Africans | 99.2 /100 | #81 | Exceptional $103,160 |
Demographics Similar to Czechs by Householder Income Ages 25 - 44 years
In terms of householder income ages 25 - 44 years, the demographic groups most similar to Czechs are South American Indian ($96,497, a difference of 0.030%), Slovene ($96,439, a difference of 0.090%), Ugandan ($96,667, a difference of 0.15%), Slavic ($96,377, a difference of 0.15%), and Basque ($96,709, a difference of 0.19%).
| Demographics | Rating | Rank | Householder Income Ages 25 - 44 years |
| Immigrants | Chile | 80.8 /100 | #144 | Excellent $97,159 |
| Norwegians | 78.2 /100 | #145 | Good $96,866 |
| Ethiopians | 77.8 /100 | #146 | Good $96,824 |
| Immigrants | Syria | 77.4 /100 | #147 | Good $96,789 |
| Irish | 76.9 /100 | #148 | Good $96,730 |
| Basques | 76.6 /100 | #149 | Good $96,709 |
| Ugandans | 76.2 /100 | #150 | Good $96,667 |
| Czechs | 74.8 /100 | #151 | Good $96,525 |
| South American Indians | 74.5 /100 | #152 | Good $96,497 |
| Slovenes | 73.9 /100 | #153 | Good $96,439 |
| Slavs | 73.2 /100 | #154 | Good $96,377 |
| Moroccans | 70.3 /100 | #155 | Good $96,117 |
| Immigrants | Germany | 67.9 /100 | #156 | Good $95,913 |
| Immigrants | Uganda | 65.2 /100 | #157 | Good $95,698 |
| Scandinavians | 63.9 /100 | #158 | Good $95,596 |