Immigrants from Serbia vs Czech Householder Income Ages 25 - 44 years
COMPARE
Immigrants from Serbia
Czech
Householder Income Ages 25 - 44 years
Householder Income Ages 25 - 44 years Comparison
Immigrants from Serbia
Czechs
$103,155
HOUSEHOLDER INCOME AGES 25 - 44 YEARS
99.2/ 100
METRIC RATING
82nd/ 347
METRIC RANK
$96,525
HOUSEHOLDER INCOME AGES 25 - 44 YEARS
74.8/ 100
METRIC RATING
151st/ 347
METRIC RANK
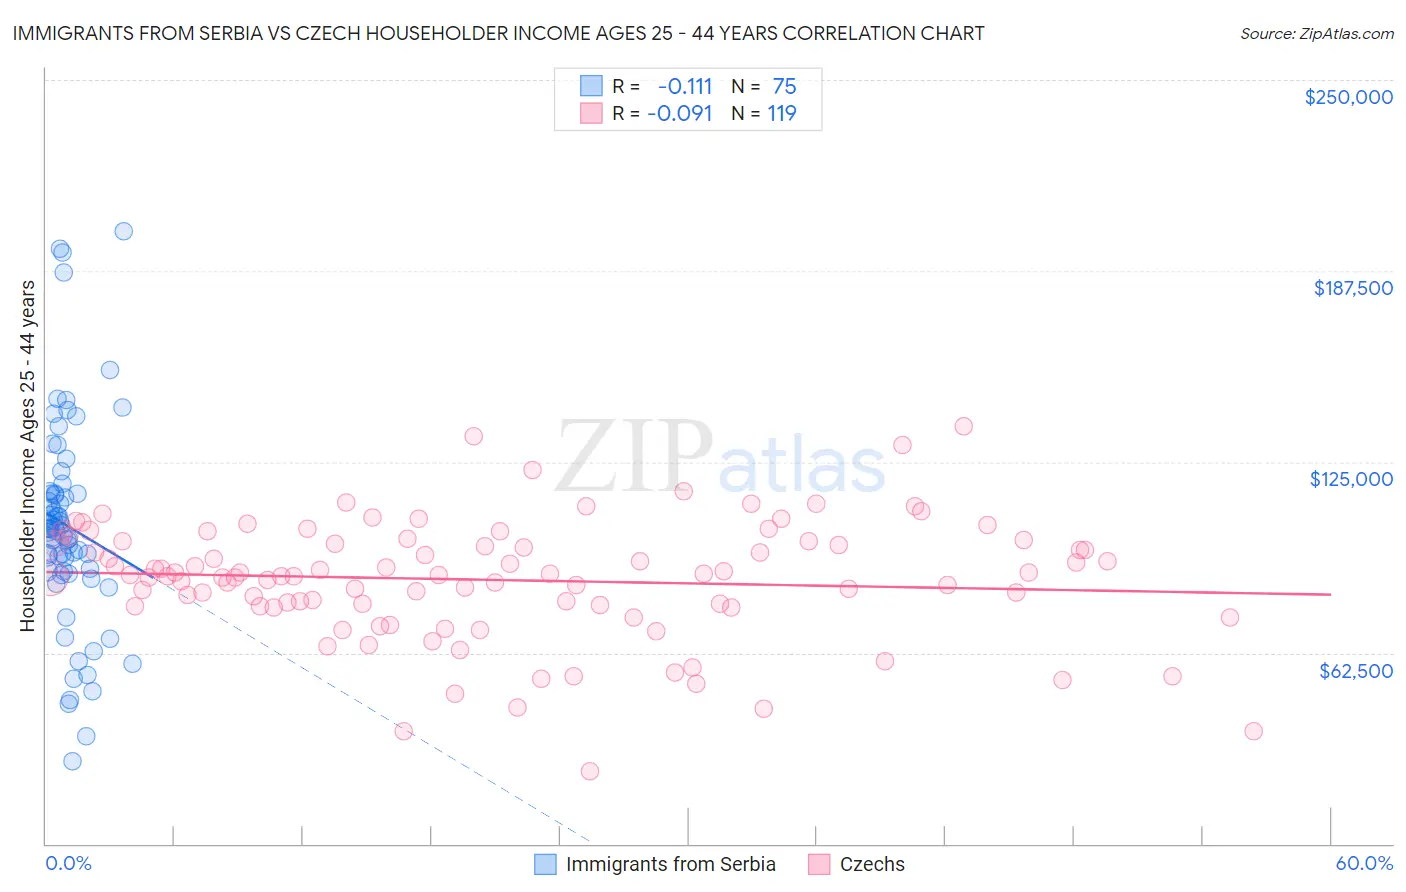
Immigrants from Serbia vs Czech Householder Income Ages 25 - 44 years Correlation Chart
The statistical analysis conducted on geographies consisting of 131,615,728 people shows a poor negative correlation between the proportion of Immigrants from Serbia and household income with householder between the ages 25 and 44 in the United States with a correlation coefficient (R) of -0.111 and weighted average of $103,155. Similarly, the statistical analysis conducted on geographies consisting of 482,514,709 people shows a slight negative correlation between the proportion of Czechs and household income with householder between the ages 25 and 44 in the United States with a correlation coefficient (R) of -0.091 and weighted average of $96,525, a difference of 6.9%.
Householder Income Ages 25 - 44 years Correlation Summary
| Measurement | Immigrants from Serbia | Czech |
| Minimum | $26,950 | $23,929 |
| Maximum | $200,677 | $136,755 |
| Range | $173,727 | $112,826 |
| Mean | $104,029 | $86,343 |
| Median | $103,165 | $87,904 |
| Interquartile 25% (IQ1) | $89,260 | $77,941 |
| Interquartile 75% (IQ3) | $114,715 | $99,022 |
| Interquartile Range (IQR) | $25,456 | $21,080 |
| Standard Deviation (Sample) | $34,050 | $19,593 |
| Standard Deviation (Population) | $33,822 | $19,511 |
Similar Demographics by Householder Income Ages 25 - 44 years
Demographics Similar to Immigrants from Serbia by Householder Income Ages 25 - 44 years
In terms of householder income ages 25 - 44 years, the demographic groups most similar to Immigrants from Serbia are South African ($103,160, a difference of 0.010%), Immigrants from Egypt ($103,192, a difference of 0.040%), Argentinean ($103,111, a difference of 0.040%), Armenian ($103,248, a difference of 0.090%), and Immigrants from Philippines ($102,910, a difference of 0.24%).
| Demographics | Rating | Rank | Householder Income Ages 25 - 44 years |
| Koreans | 99.4 /100 | #75 | Exceptional $103,824 |
| Immigrants | Spain | 99.4 /100 | #76 | Exceptional $103,752 |
| Immigrants | Southern Europe | 99.3 /100 | #77 | Exceptional $103,486 |
| Immigrants | Bulgaria | 99.3 /100 | #78 | Exceptional $103,423 |
| Armenians | 99.2 /100 | #79 | Exceptional $103,248 |
| Immigrants | Egypt | 99.2 /100 | #80 | Exceptional $103,192 |
| South Africans | 99.2 /100 | #81 | Exceptional $103,160 |
| Immigrants | Serbia | 99.2 /100 | #82 | Exceptional $103,155 |
| Argentineans | 99.1 /100 | #83 | Exceptional $103,111 |
| Immigrants | Philippines | 99.0 /100 | #84 | Exceptional $102,910 |
| Immigrants | Ukraine | 98.9 /100 | #85 | Exceptional $102,664 |
| Immigrants | Hungary | 98.9 /100 | #86 | Exceptional $102,655 |
| Immigrants | Western Europe | 98.9 /100 | #87 | Exceptional $102,654 |
| Immigrants | Canada | 98.9 /100 | #88 | Exceptional $102,616 |
| Romanians | 98.8 /100 | #89 | Exceptional $102,544 |
Demographics Similar to Czechs by Householder Income Ages 25 - 44 years
In terms of householder income ages 25 - 44 years, the demographic groups most similar to Czechs are South American Indian ($96,497, a difference of 0.030%), Slovene ($96,439, a difference of 0.090%), Ugandan ($96,667, a difference of 0.15%), Slavic ($96,377, a difference of 0.15%), and Basque ($96,709, a difference of 0.19%).
| Demographics | Rating | Rank | Householder Income Ages 25 - 44 years |
| Immigrants | Chile | 80.8 /100 | #144 | Excellent $97,159 |
| Norwegians | 78.2 /100 | #145 | Good $96,866 |
| Ethiopians | 77.8 /100 | #146 | Good $96,824 |
| Immigrants | Syria | 77.4 /100 | #147 | Good $96,789 |
| Irish | 76.9 /100 | #148 | Good $96,730 |
| Basques | 76.6 /100 | #149 | Good $96,709 |
| Ugandans | 76.2 /100 | #150 | Good $96,667 |
| Czechs | 74.8 /100 | #151 | Good $96,525 |
| South American Indians | 74.5 /100 | #152 | Good $96,497 |
| Slovenes | 73.9 /100 | #153 | Good $96,439 |
| Slavs | 73.2 /100 | #154 | Good $96,377 |
| Moroccans | 70.3 /100 | #155 | Good $96,117 |
| Immigrants | Germany | 67.9 /100 | #156 | Good $95,913 |
| Immigrants | Uganda | 65.2 /100 | #157 | Good $95,698 |
| Scandinavians | 63.9 /100 | #158 | Good $95,596 |