Immigrants from Bangladesh vs Czech Householder Income Ages 25 - 44 years
COMPARE
Immigrants from Bangladesh
Czech
Householder Income Ages 25 - 44 years
Householder Income Ages 25 - 44 years Comparison
Immigrants from Bangladesh
Czechs
$90,448
HOUSEHOLDER INCOME AGES 25 - 44 YEARS
9.3/ 100
METRIC RATING
213th/ 347
METRIC RANK
$96,525
HOUSEHOLDER INCOME AGES 25 - 44 YEARS
74.8/ 100
METRIC RATING
151st/ 347
METRIC RANK
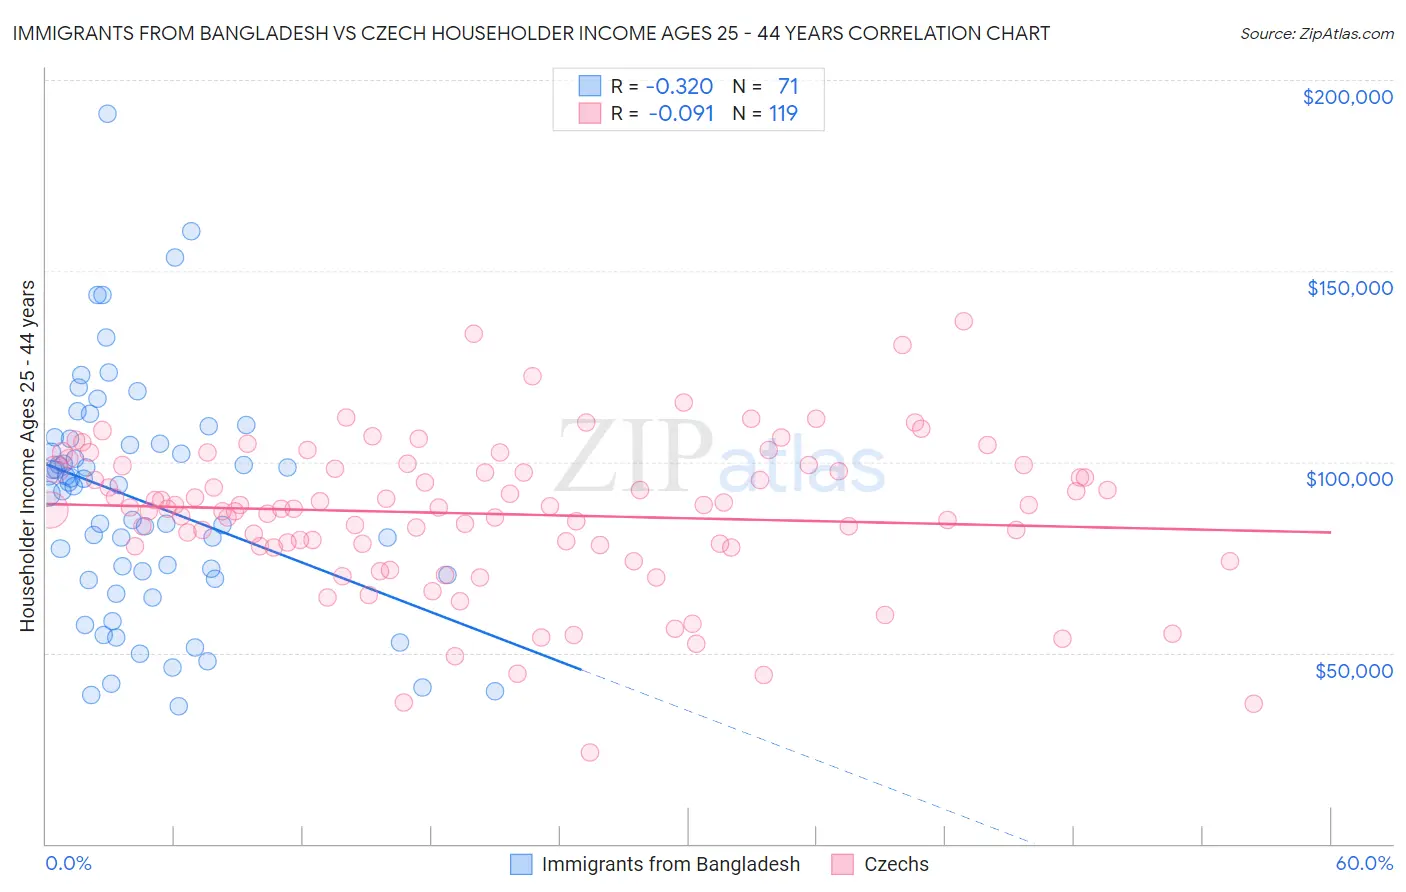
Immigrants from Bangladesh vs Czech Householder Income Ages 25 - 44 years Correlation Chart
The statistical analysis conducted on geographies consisting of 203,449,247 people shows a mild negative correlation between the proportion of Immigrants from Bangladesh and household income with householder between the ages 25 and 44 in the United States with a correlation coefficient (R) of -0.320 and weighted average of $90,448. Similarly, the statistical analysis conducted on geographies consisting of 482,514,709 people shows a slight negative correlation between the proportion of Czechs and household income with householder between the ages 25 and 44 in the United States with a correlation coefficient (R) of -0.091 and weighted average of $96,525, a difference of 6.7%.
Householder Income Ages 25 - 44 years Correlation Summary
| Measurement | Immigrants from Bangladesh | Czech |
| Minimum | $35,868 | $23,929 |
| Maximum | $191,104 | $136,755 |
| Range | $155,236 | $112,826 |
| Mean | $89,510 | $86,343 |
| Median | $93,714 | $87,904 |
| Interquartile 25% (IQ1) | $69,551 | $77,941 |
| Interquartile 75% (IQ3) | $104,853 | $99,022 |
| Interquartile Range (IQR) | $35,302 | $21,080 |
| Standard Deviation (Sample) | $30,547 | $19,593 |
| Standard Deviation (Population) | $30,331 | $19,511 |
Similar Demographics by Householder Income Ages 25 - 44 years
Demographics Similar to Immigrants from Bangladesh by Householder Income Ages 25 - 44 years
In terms of householder income ages 25 - 44 years, the demographic groups most similar to Immigrants from Bangladesh are Immigrants from Africa ($90,372, a difference of 0.090%), Panamanian ($90,193, a difference of 0.28%), Hawaiian ($90,722, a difference of 0.30%), Immigrants from Kenya ($90,767, a difference of 0.35%), and Iraqi ($90,764, a difference of 0.35%).
| Demographics | Rating | Rank | Householder Income Ages 25 - 44 years |
| Aleuts | 14.5 /100 | #206 | Poor $91,370 |
| Yugoslavians | 14.5 /100 | #207 | Poor $91,368 |
| Immigrants | Thailand | 14.3 /100 | #208 | Poor $91,337 |
| Immigrants | Uruguay | 13.2 /100 | #209 | Poor $91,171 |
| Immigrants | Kenya | 10.9 /100 | #210 | Poor $90,767 |
| Iraqis | 10.8 /100 | #211 | Poor $90,764 |
| Hawaiians | 10.6 /100 | #212 | Poor $90,722 |
| Immigrants | Bangladesh | 9.3 /100 | #213 | Tragic $90,448 |
| Immigrants | Africa | 8.9 /100 | #214 | Tragic $90,372 |
| Panamanians | 8.1 /100 | #215 | Tragic $90,193 |
| Ghanaians | 7.9 /100 | #216 | Tragic $90,137 |
| Scotch-Irish | 7.3 /100 | #217 | Tragic $89,969 |
| Guyanese | 7.1 /100 | #218 | Tragic $89,940 |
| Delaware | 6.9 /100 | #219 | Tragic $89,876 |
| Trinidadians and Tobagonians | 6.8 /100 | #220 | Tragic $89,856 |
Demographics Similar to Czechs by Householder Income Ages 25 - 44 years
In terms of householder income ages 25 - 44 years, the demographic groups most similar to Czechs are South American Indian ($96,497, a difference of 0.030%), Slovene ($96,439, a difference of 0.090%), Ugandan ($96,667, a difference of 0.15%), Slavic ($96,377, a difference of 0.15%), and Basque ($96,709, a difference of 0.19%).
| Demographics | Rating | Rank | Householder Income Ages 25 - 44 years |
| Immigrants | Chile | 80.8 /100 | #144 | Excellent $97,159 |
| Norwegians | 78.2 /100 | #145 | Good $96,866 |
| Ethiopians | 77.8 /100 | #146 | Good $96,824 |
| Immigrants | Syria | 77.4 /100 | #147 | Good $96,789 |
| Irish | 76.9 /100 | #148 | Good $96,730 |
| Basques | 76.6 /100 | #149 | Good $96,709 |
| Ugandans | 76.2 /100 | #150 | Good $96,667 |
| Czechs | 74.8 /100 | #151 | Good $96,525 |
| South American Indians | 74.5 /100 | #152 | Good $96,497 |
| Slovenes | 73.9 /100 | #153 | Good $96,439 |
| Slavs | 73.2 /100 | #154 | Good $96,377 |
| Moroccans | 70.3 /100 | #155 | Good $96,117 |
| Immigrants | Germany | 67.9 /100 | #156 | Good $95,913 |
| Immigrants | Uganda | 65.2 /100 | #157 | Good $95,698 |
| Scandinavians | 63.9 /100 | #158 | Good $95,596 |