Immigrants from Fiji vs Czech 2nd Grade
COMPARE
Immigrants from Fiji
Czech
2nd Grade
2nd Grade Comparison
Immigrants from Fiji
Czechs
96.4%
2ND GRADE
0.0/ 100
METRIC RATING
336th/ 347
METRIC RANK
98.5%
2ND GRADE
100.0/ 100
METRIC RATING
31st/ 347
METRIC RANK
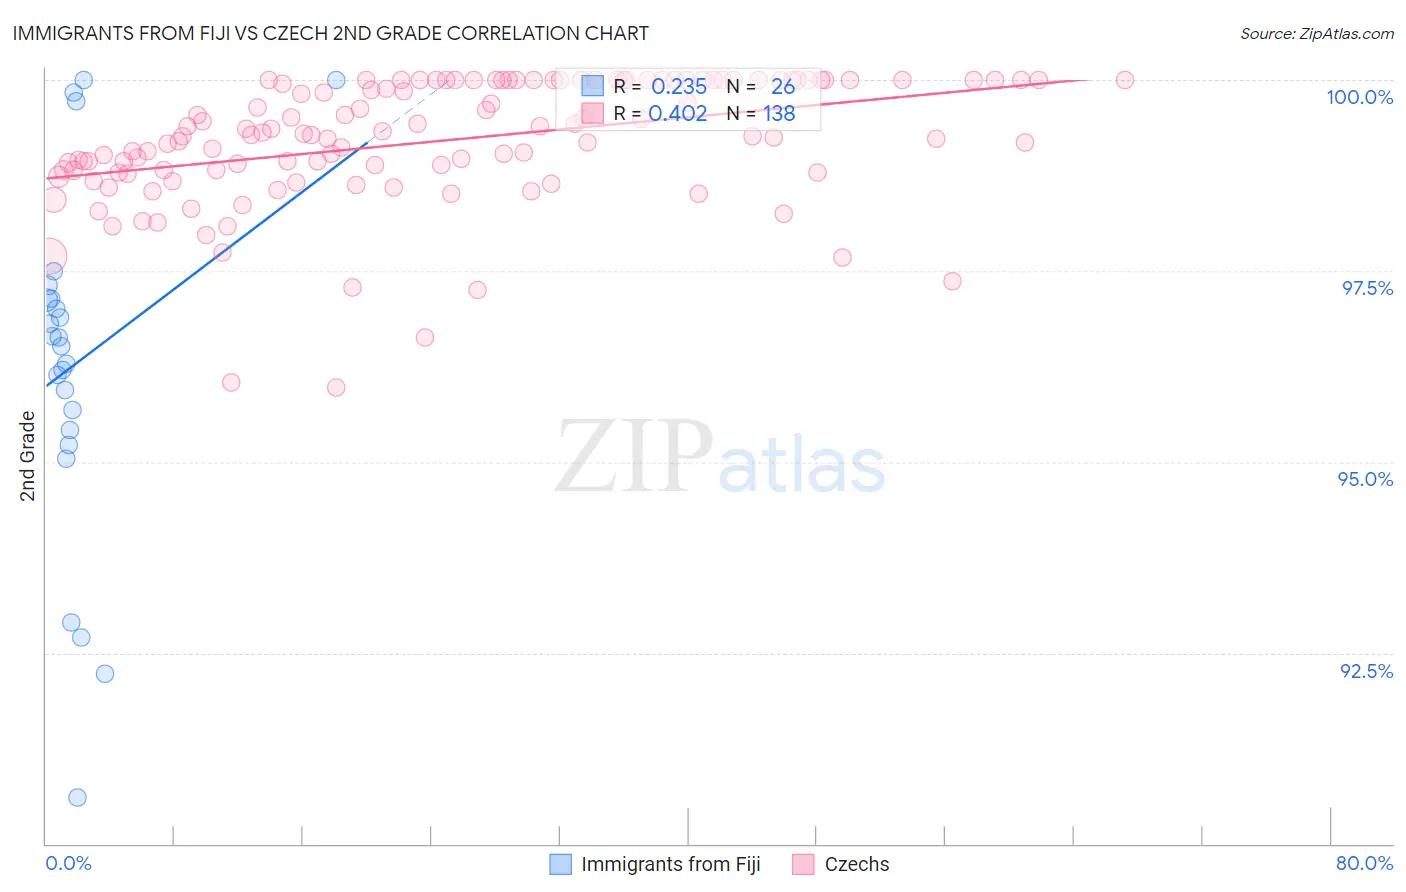
Immigrants from Fiji vs Czech 2nd Grade Correlation Chart
The statistical analysis conducted on geographies consisting of 93,756,204 people shows a weak positive correlation between the proportion of Immigrants from Fiji and percentage of population with at least 2nd grade education in the United States with a correlation coefficient (R) of 0.235 and weighted average of 96.4%. Similarly, the statistical analysis conducted on geographies consisting of 484,813,102 people shows a moderate positive correlation between the proportion of Czechs and percentage of population with at least 2nd grade education in the United States with a correlation coefficient (R) of 0.402 and weighted average of 98.5%, a difference of 2.2%.
2nd Grade Correlation Summary
| Measurement | Immigrants from Fiji | Czech |
| Minimum | 90.6% | 96.0% |
| Maximum | 100.0% | 100.0% |
| Range | 9.4% | 4.0% |
| Mean | 96.3% | 99.2% |
| Median | 96.6% | 99.3% |
| Interquartile 25% (IQ1) | 95.4% | 98.8% |
| Interquartile 75% (IQ3) | 97.1% | 100.0% |
| Interquartile Range (IQR) | 1.7% | 1.2% |
| Standard Deviation (Sample) | 2.3% | 0.82% |
| Standard Deviation (Population) | 2.3% | 0.82% |
Similar Demographics by 2nd Grade
Demographics Similar to Immigrants from Fiji by 2nd Grade
In terms of 2nd grade, the demographic groups most similar to Immigrants from Fiji are Yakama (96.4%, a difference of 0.010%), Immigrants from Cambodia (96.4%, a difference of 0.010%), Central American (96.4%, a difference of 0.020%), Immigrants from Cabo Verde (96.3%, a difference of 0.030%), and Immigrants from Dominican Republic (96.4%, a difference of 0.040%).
| Demographics | Rating | Rank | 2nd Grade |
| Japanese | 0.0 /100 | #329 | Tragic 96.5% |
| Immigrants | Latin America | 0.0 /100 | #330 | Tragic 96.5% |
| Immigrants | Armenia | 0.0 /100 | #331 | Tragic 96.5% |
| Bangladeshis | 0.0 /100 | #332 | Tragic 96.5% |
| Immigrants | Dominican Republic | 0.0 /100 | #333 | Tragic 96.4% |
| Central Americans | 0.0 /100 | #334 | Tragic 96.4% |
| Yakama | 0.0 /100 | #335 | Tragic 96.4% |
| Immigrants | Fiji | 0.0 /100 | #336 | Tragic 96.4% |
| Immigrants | Cambodia | 0.0 /100 | #337 | Tragic 96.4% |
| Immigrants | Cabo Verde | 0.0 /100 | #338 | Tragic 96.3% |
| Guatemalans | 0.0 /100 | #339 | Tragic 96.3% |
| Immigrants | Guatemala | 0.0 /100 | #340 | Tragic 96.2% |
| Immigrants | Central America | 0.0 /100 | #341 | Tragic 96.2% |
| Immigrants | Mexico | 0.0 /100 | #342 | Tragic 96.1% |
| Nepalese | 0.0 /100 | #343 | Tragic 96.1% |
Demographics Similar to Czechs by 2nd Grade
In terms of 2nd grade, the demographic groups most similar to Czechs are European (98.5%, a difference of 0.0%), French Canadian (98.5%, a difference of 0.0%), Arapaho (98.5%, a difference of 0.010%), French (98.5%, a difference of 0.010%), and Scandinavian (98.5%, a difference of 0.010%).
| Demographics | Rating | Rank | 2nd Grade |
| Pennsylvania Germans | 100.0 /100 | #24 | Exceptional 98.5% |
| Scotch-Irish | 100.0 /100 | #25 | Exceptional 98.5% |
| Welsh | 100.0 /100 | #26 | Exceptional 98.5% |
| Croatians | 100.0 /100 | #27 | Exceptional 98.5% |
| Arapaho | 100.0 /100 | #28 | Exceptional 98.5% |
| French | 100.0 /100 | #29 | Exceptional 98.5% |
| Europeans | 100.0 /100 | #30 | Exceptional 98.5% |
| Czechs | 100.0 /100 | #31 | Exceptional 98.5% |
| French Canadians | 100.0 /100 | #32 | Exceptional 98.5% |
| Scandinavians | 100.0 /100 | #33 | Exceptional 98.5% |
| Chinese | 100.0 /100 | #34 | Exceptional 98.5% |
| Swiss | 100.0 /100 | #35 | Exceptional 98.5% |
| British | 100.0 /100 | #36 | Exceptional 98.5% |
| Italians | 99.9 /100 | #37 | Exceptional 98.4% |
| Latvians | 99.9 /100 | #38 | Exceptional 98.4% |