Arab vs Czech Householder Income Ages 25 - 44 years
COMPARE
Arab
Czech
Householder Income Ages 25 - 44 years
Householder Income Ages 25 - 44 years Comparison
Arabs
Czechs
$97,336
HOUSEHOLDER INCOME AGES 25 - 44 YEARS
82.3/ 100
METRIC RATING
138th/ 347
METRIC RANK
$96,525
HOUSEHOLDER INCOME AGES 25 - 44 YEARS
74.8/ 100
METRIC RATING
151st/ 347
METRIC RANK
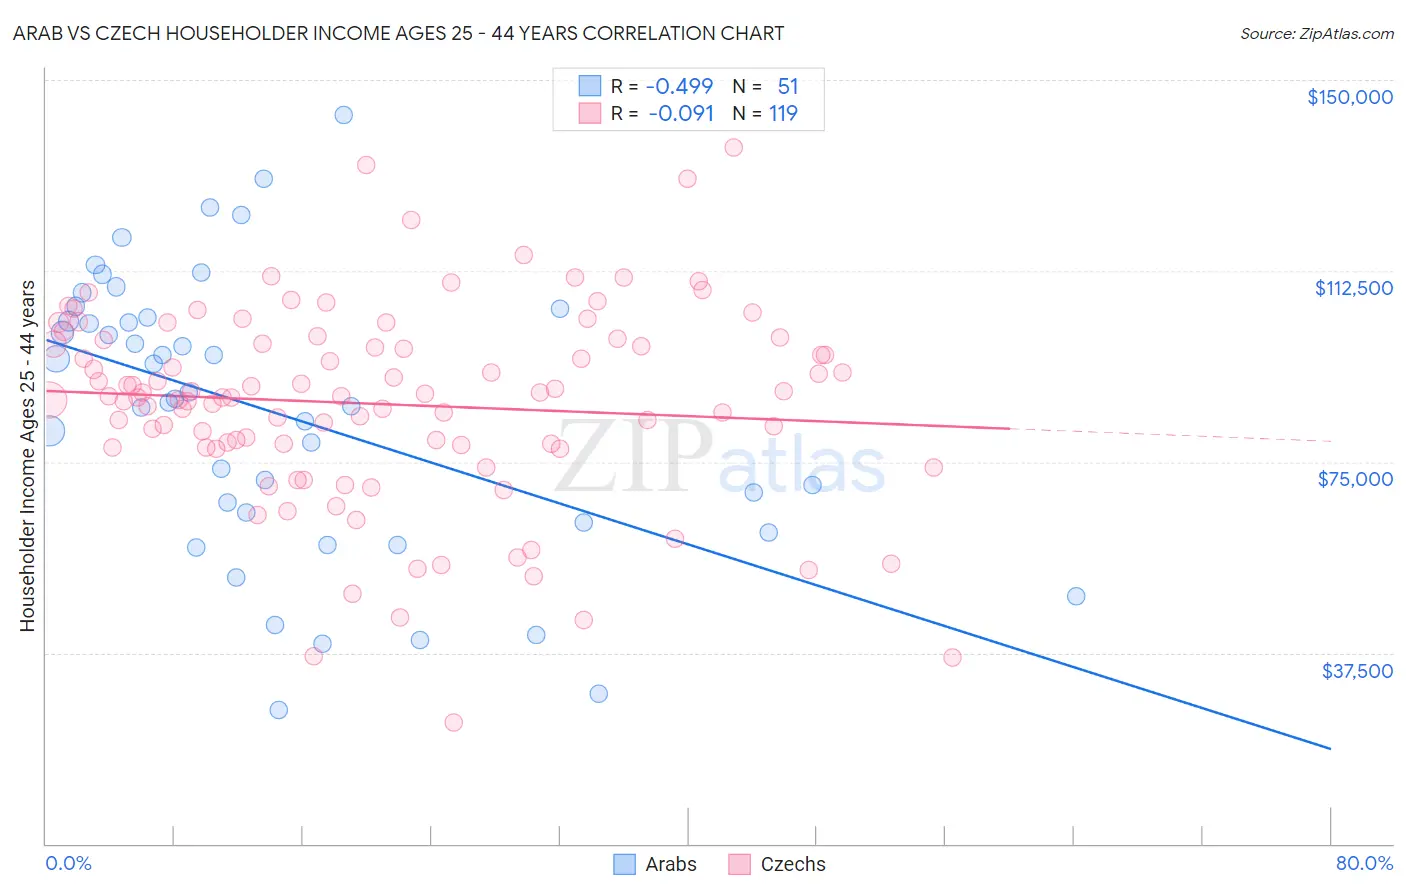
Arab vs Czech Householder Income Ages 25 - 44 years Correlation Chart
The statistical analysis conducted on geographies consisting of 484,835,242 people shows a moderate negative correlation between the proportion of Arabs and household income with householder between the ages 25 and 44 in the United States with a correlation coefficient (R) of -0.499 and weighted average of $97,336. Similarly, the statistical analysis conducted on geographies consisting of 482,514,709 people shows a slight negative correlation between the proportion of Czechs and household income with householder between the ages 25 and 44 in the United States with a correlation coefficient (R) of -0.091 and weighted average of $96,525, a difference of 0.84%.
Householder Income Ages 25 - 44 years Correlation Summary
| Measurement | Arab | Czech |
| Minimum | $26,250 | $23,929 |
| Maximum | $143,125 | $136,755 |
| Range | $116,875 | $112,826 |
| Mean | $84,482 | $86,343 |
| Median | $87,286 | $87,904 |
| Interquartile 25% (IQ1) | $63,008 | $77,941 |
| Interquartile 75% (IQ3) | $103,414 | $99,022 |
| Interquartile Range (IQR) | $40,406 | $21,080 |
| Standard Deviation (Sample) | $27,531 | $19,593 |
| Standard Deviation (Population) | $27,260 | $19,511 |
Demographics Similar to Arabs and Czechs by Householder Income Ages 25 - 44 years
In terms of householder income ages 25 - 44 years, the demographic groups most similar to Arabs are Lebanese ($97,339, a difference of 0.0%), Immigrants from Peru ($97,329, a difference of 0.010%), Immigrants from Morocco ($97,305, a difference of 0.030%), Luxembourger ($97,237, a difference of 0.10%), and Danish ($97,221, a difference of 0.12%). Similarly, the demographic groups most similar to Czechs are South American Indian ($96,497, a difference of 0.030%), Slovene ($96,439, a difference of 0.090%), Ugandan ($96,667, a difference of 0.15%), Slavic ($96,377, a difference of 0.15%), and Basque ($96,709, a difference of 0.19%).
| Demographics | Rating | Rank | Householder Income Ages 25 - 44 years |
| Canadians | 84.5 /100 | #134 | Excellent $97,625 |
| Immigrants | Oceania | 84.5 /100 | #135 | Excellent $97,623 |
| Hungarians | 83.9 /100 | #136 | Excellent $97,544 |
| Lebanese | 82.3 /100 | #137 | Excellent $97,339 |
| Arabs | 82.3 /100 | #138 | Excellent $97,336 |
| Immigrants | Peru | 82.2 /100 | #139 | Excellent $97,329 |
| Immigrants | Morocco | 82.0 /100 | #140 | Excellent $97,305 |
| Luxembourgers | 81.5 /100 | #141 | Excellent $97,237 |
| Danes | 81.3 /100 | #142 | Excellent $97,221 |
| Immigrants | Jordan | 81.0 /100 | #143 | Excellent $97,185 |
| Immigrants | Chile | 80.8 /100 | #144 | Excellent $97,159 |
| Norwegians | 78.2 /100 | #145 | Good $96,866 |
| Ethiopians | 77.8 /100 | #146 | Good $96,824 |
| Immigrants | Syria | 77.4 /100 | #147 | Good $96,789 |
| Irish | 76.9 /100 | #148 | Good $96,730 |
| Basques | 76.6 /100 | #149 | Good $96,709 |
| Ugandans | 76.2 /100 | #150 | Good $96,667 |
| Czechs | 74.8 /100 | #151 | Good $96,525 |
| South American Indians | 74.5 /100 | #152 | Good $96,497 |
| Slovenes | 73.9 /100 | #153 | Good $96,439 |
| Slavs | 73.2 /100 | #154 | Good $96,377 |