Immigrants from Ethiopia vs Syrian 3rd Grade
COMPARE
Immigrants from Ethiopia
Syrian
3rd Grade
3rd Grade Comparison
Immigrants from Ethiopia
Syrians
97.3%
3RD GRADE
0.4/ 100
METRIC RATING
260th/ 347
METRIC RANK
98.0%
3RD GRADE
93.8/ 100
METRIC RATING
123rd/ 347
METRIC RANK
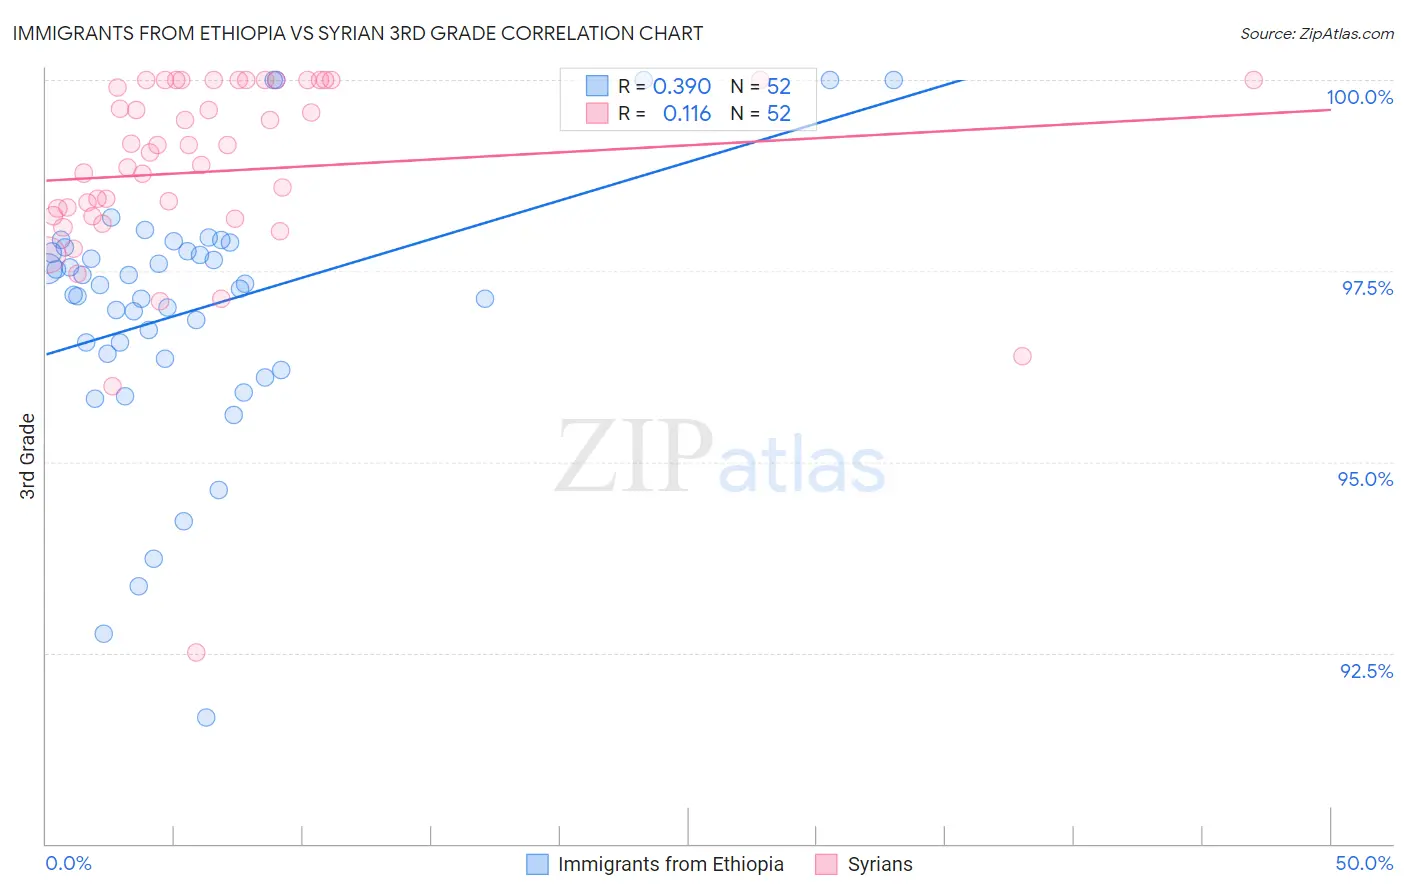
Immigrants from Ethiopia vs Syrian 3rd Grade Correlation Chart
The statistical analysis conducted on geographies consisting of 211,514,076 people shows a mild positive correlation between the proportion of Immigrants from Ethiopia and percentage of population with at least 3rd grade education in the United States with a correlation coefficient (R) of 0.390 and weighted average of 97.3%. Similarly, the statistical analysis conducted on geographies consisting of 266,305,988 people shows a poor positive correlation between the proportion of Syrians and percentage of population with at least 3rd grade education in the United States with a correlation coefficient (R) of 0.116 and weighted average of 98.0%, a difference of 0.70%.
3rd Grade Correlation Summary
| Measurement | Immigrants from Ethiopia | Syrian |
| Minimum | 91.7% | 92.5% |
| Maximum | 100.0% | 100.0% |
| Range | 8.3% | 7.5% |
| Mean | 97.0% | 98.8% |
| Median | 97.3% | 99.1% |
| Interquartile 25% (IQ1) | 96.4% | 98.2% |
| Interquartile 75% (IQ3) | 97.8% | 100.0% |
| Interquartile Range (IQR) | 1.4% | 1.8% |
| Standard Deviation (Sample) | 1.7% | 1.4% |
| Standard Deviation (Population) | 1.7% | 1.3% |
Similar Demographics by 3rd Grade
Demographics Similar to Immigrants from Ethiopia by 3rd Grade
In terms of 3rd grade, the demographic groups most similar to Immigrants from Ethiopia are Immigrants from South America (97.3%, a difference of 0.0%), Immigrants from Liberia (97.3%, a difference of 0.010%), Armenian (97.3%, a difference of 0.010%), Immigrants from Sierra Leone (97.3%, a difference of 0.010%), and Immigrants from Colombia (97.3%, a difference of 0.020%).
| Demographics | Rating | Rank | 3rd Grade |
| Immigrants | Africa | 0.8 /100 | #253 | Tragic 97.4% |
| Jamaicans | 0.7 /100 | #254 | Tragic 97.4% |
| Bolivians | 0.6 /100 | #255 | Tragic 97.3% |
| Immigrants | Congo | 0.6 /100 | #256 | Tragic 97.3% |
| Immigrants | Colombia | 0.5 /100 | #257 | Tragic 97.3% |
| Immigrants | Liberia | 0.5 /100 | #258 | Tragic 97.3% |
| Armenians | 0.4 /100 | #259 | Tragic 97.3% |
| Immigrants | Ethiopia | 0.4 /100 | #260 | Tragic 97.3% |
| Immigrants | South America | 0.4 /100 | #261 | Tragic 97.3% |
| Immigrants | Sierra Leone | 0.4 /100 | #262 | Tragic 97.3% |
| Taiwanese | 0.3 /100 | #263 | Tragic 97.3% |
| West Indians | 0.3 /100 | #264 | Tragic 97.3% |
| Immigrants | Jamaica | 0.3 /100 | #265 | Tragic 97.3% |
| Yaqui | 0.3 /100 | #266 | Tragic 97.3% |
| Immigrants | Nigeria | 0.3 /100 | #267 | Tragic 97.3% |
Demographics Similar to Syrians by 3rd Grade
In terms of 3rd grade, the demographic groups most similar to Syrians are Immigrants from Japan (98.0%, a difference of 0.0%), Immigrants from Saudi Arabia (98.0%, a difference of 0.0%), Immigrants from Croatia (98.0%, a difference of 0.010%), Iroquois (98.0%, a difference of 0.010%), and Lebanese (98.0%, a difference of 0.010%).
| Demographics | Rating | Rank | 3rd Grade |
| Immigrants | Norway | 95.2 /100 | #116 | Exceptional 98.0% |
| Immigrants | France | 95.1 /100 | #117 | Exceptional 98.0% |
| Iranians | 94.9 /100 | #118 | Exceptional 98.0% |
| Spanish | 94.8 /100 | #119 | Exceptional 98.0% |
| Immigrants | Croatia | 94.4 /100 | #120 | Exceptional 98.0% |
| Iroquois | 94.1 /100 | #121 | Exceptional 98.0% |
| Lebanese | 94.1 /100 | #122 | Exceptional 98.0% |
| Syrians | 93.8 /100 | #123 | Exceptional 98.0% |
| Immigrants | Japan | 93.7 /100 | #124 | Exceptional 98.0% |
| Immigrants | Saudi Arabia | 93.5 /100 | #125 | Exceptional 98.0% |
| Immigrants | Zimbabwe | 93.4 /100 | #126 | Exceptional 98.0% |
| Ute | 93.2 /100 | #127 | Exceptional 98.0% |
| Colville | 92.1 /100 | #128 | Exceptional 98.0% |
| Immigrants | Serbia | 91.9 /100 | #129 | Exceptional 98.0% |
| Immigrants | Europe | 91.2 /100 | #130 | Exceptional 98.0% |