Immigrants from Eritrea vs Immigrants from Kenya Median Male Earnings
COMPARE
Immigrants from Eritrea
Immigrants from Kenya
Median Male Earnings
Median Male Earnings Comparison
Immigrants from Eritrea
Immigrants from Kenya
$53,715
MEDIAN MALE EARNINGS
31.8/ 100
METRIC RATING
187th/ 347
METRIC RANK
$53,427
MEDIAN MALE EARNINGS
26.0/ 100
METRIC RATING
197th/ 347
METRIC RANK
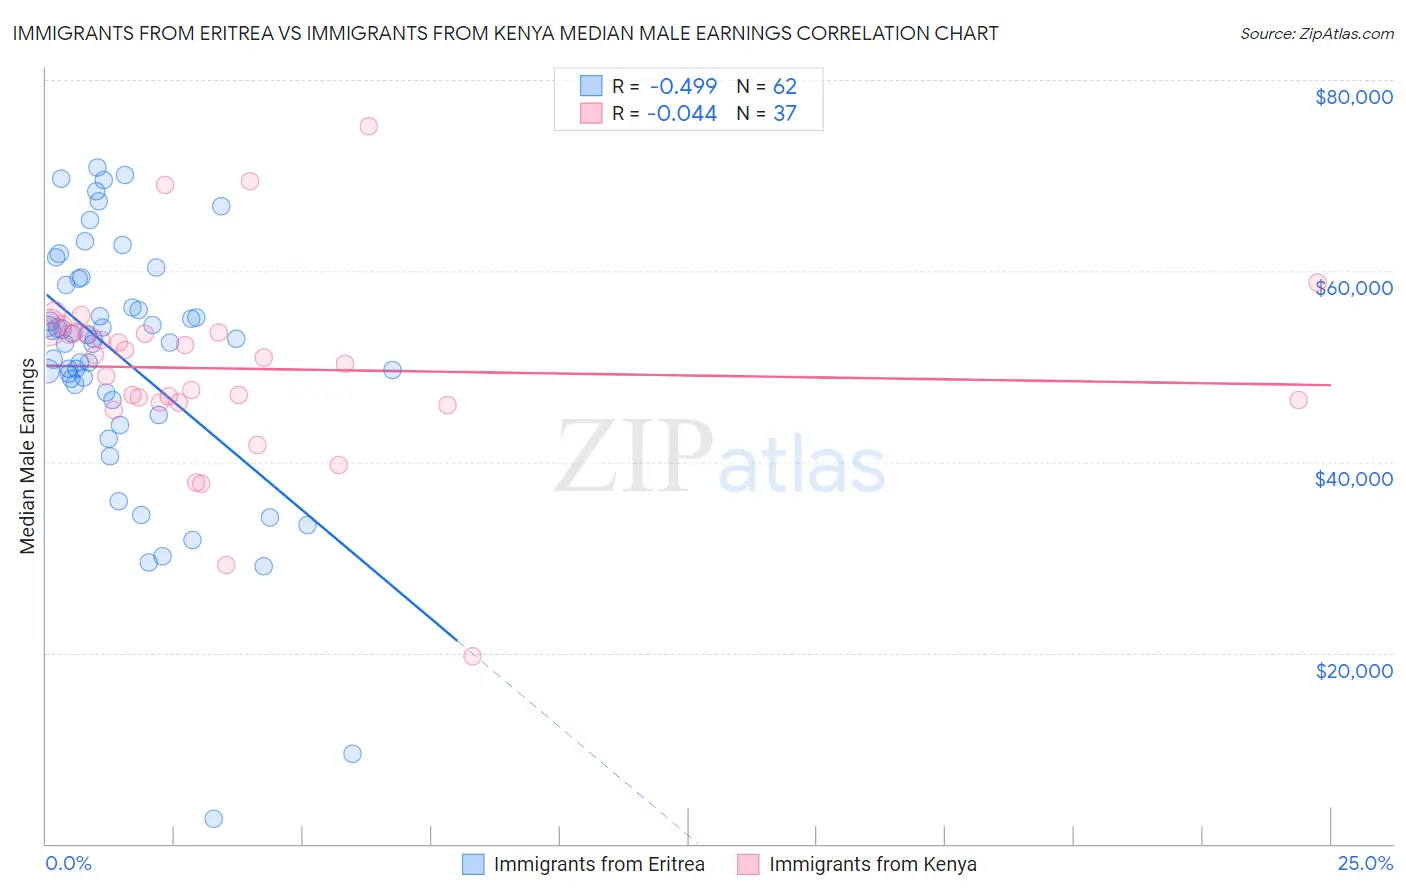
Immigrants from Eritrea vs Immigrants from Kenya Median Male Earnings Correlation Chart
The statistical analysis conducted on geographies consisting of 104,828,804 people shows a moderate negative correlation between the proportion of Immigrants from Eritrea and median male earnings in the United States with a correlation coefficient (R) of -0.499 and weighted average of $53,715. Similarly, the statistical analysis conducted on geographies consisting of 218,068,139 people shows no correlation between the proportion of Immigrants from Kenya and median male earnings in the United States with a correlation coefficient (R) of -0.044 and weighted average of $53,427, a difference of 0.54%.
Median Male Earnings Correlation Summary
| Measurement | Immigrants from Eritrea | Immigrants from Kenya |
| Minimum | $2,614 | $19,659 |
| Maximum | $70,824 | $75,179 |
| Range | $68,210 | $55,520 |
| Mean | $50,677 | $49,751 |
| Median | $52,865 | $50,930 |
| Interquartile 25% (IQ1) | $47,273 | $46,171 |
| Interquartile 75% (IQ3) | $58,480 | $53,573 |
| Interquartile Range (IQR) | $11,207 | $7,402 |
| Standard Deviation (Sample) | $13,241 | $9,966 |
| Standard Deviation (Population) | $13,134 | $9,831 |
Demographics Similar to Immigrants from Eritrea and Immigrants from Kenya by Median Male Earnings
In terms of median male earnings, the demographic groups most similar to Immigrants from Eritrea are Immigrants from Eastern Africa ($53,713, a difference of 0.0%), Puget Sound Salish ($53,704, a difference of 0.020%), Uruguayan ($53,680, a difference of 0.060%), Guamanian/Chamorro ($53,661, a difference of 0.10%), and Scotch-Irish ($53,658, a difference of 0.11%). Similarly, the demographic groups most similar to Immigrants from Kenya are Immigrants from Africa ($53,457, a difference of 0.060%), Immigrants from the Azores ($53,503, a difference of 0.14%), Spanish ($53,576, a difference of 0.28%), Immigrants from Costa Rica ($53,237, a difference of 0.36%), and Tongan ($53,218, a difference of 0.39%).
| Demographics | Rating | Rank | Median Male Earnings |
| Yugoslavians | 37.4 /100 | #182 | Fair $53,967 |
| Immigrants | South America | 37.3 /100 | #183 | Fair $53,962 |
| Whites/Caucasians | 36.5 /100 | #184 | Fair $53,925 |
| Immigrants | Sierra Leone | 36.0 /100 | #185 | Fair $53,905 |
| Colombians | 34.4 /100 | #186 | Fair $53,832 |
| Immigrants | Eritrea | 31.8 /100 | #187 | Fair $53,715 |
| Immigrants | Eastern Africa | 31.8 /100 | #188 | Fair $53,713 |
| Puget Sound Salish | 31.6 /100 | #189 | Fair $53,704 |
| Uruguayans | 31.1 /100 | #190 | Fair $53,680 |
| Guamanians/Chamorros | 30.7 /100 | #191 | Fair $53,661 |
| Scotch-Irish | 30.6 /100 | #192 | Fair $53,658 |
| Kenyans | 30.4 /100 | #193 | Fair $53,647 |
| Spanish | 29.0 /100 | #194 | Fair $53,576 |
| Immigrants | Azores | 27.5 /100 | #195 | Fair $53,503 |
| Immigrants | Africa | 26.6 /100 | #196 | Fair $53,457 |
| Immigrants | Kenya | 26.0 /100 | #197 | Fair $53,427 |
| Immigrants | Costa Rica | 22.6 /100 | #198 | Fair $53,237 |
| Tongans | 22.3 /100 | #199 | Fair $53,218 |
| Immigrants | Thailand | 17.5 /100 | #200 | Poor $52,908 |
| Immigrants | Bosnia and Herzegovina | 16.9 /100 | #201 | Poor $52,869 |
| Immigrants | Uruguay | 16.8 /100 | #202 | Poor $52,860 |