Immigrants from El Salvador vs Iroquois Median Family Income
COMPARE
Immigrants from El Salvador
Iroquois
Median Family Income
Median Family Income Comparison
Immigrants from El Salvador
Iroquois
$92,545
MEDIAN FAMILY INCOME
0.6/ 100
METRIC RATING
252nd/ 347
METRIC RANK
$90,543
MEDIAN FAMILY INCOME
0.2/ 100
METRIC RATING
271st/ 347
METRIC RANK
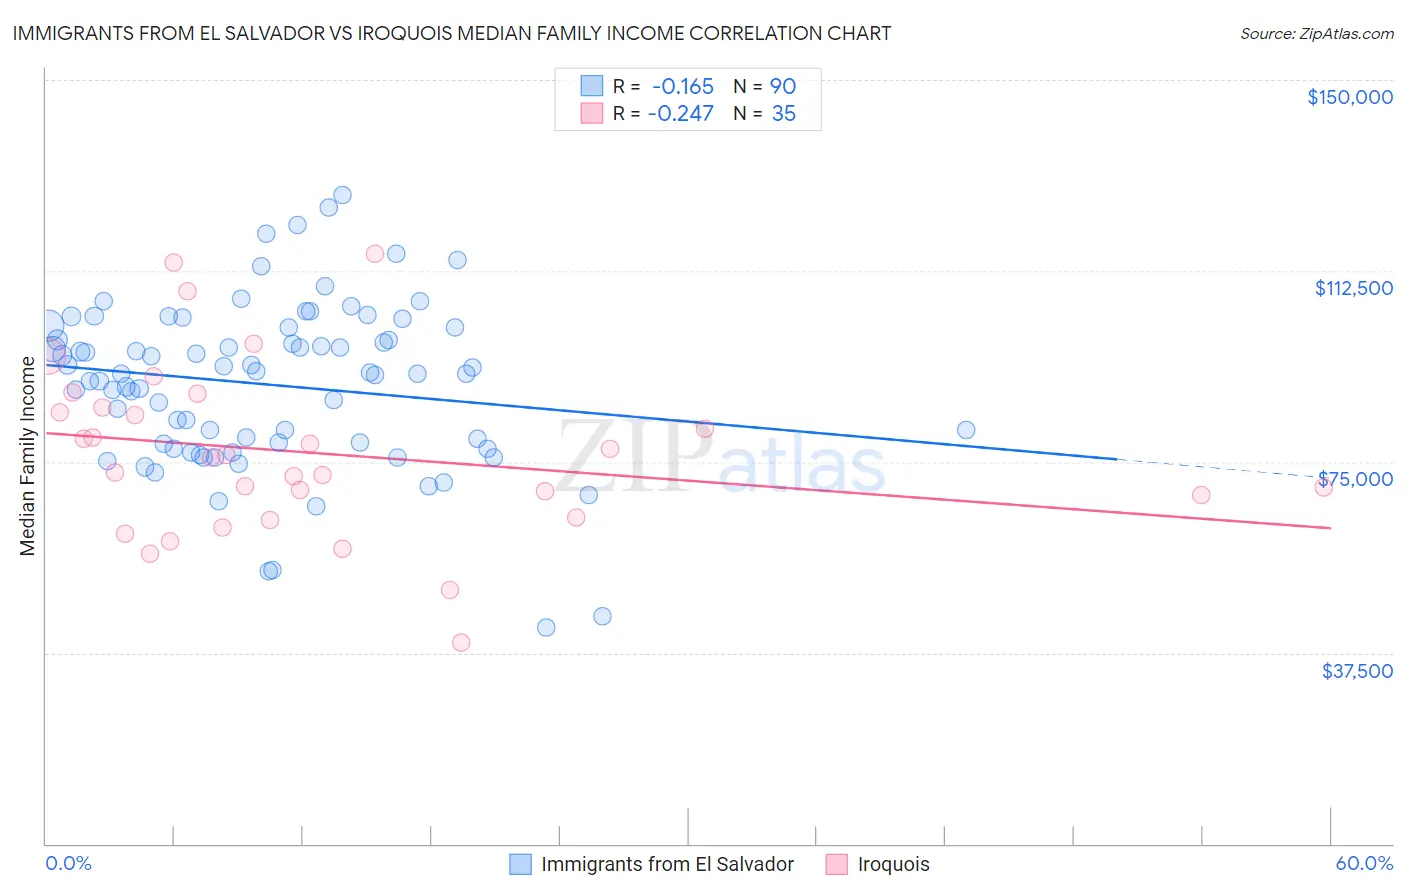
Immigrants from El Salvador vs Iroquois Median Family Income Correlation Chart
The statistical analysis conducted on geographies consisting of 357,645,519 people shows a poor negative correlation between the proportion of Immigrants from El Salvador and median family income in the United States with a correlation coefficient (R) of -0.165 and weighted average of $92,545. Similarly, the statistical analysis conducted on geographies consisting of 207,203,022 people shows a weak negative correlation between the proportion of Iroquois and median family income in the United States with a correlation coefficient (R) of -0.247 and weighted average of $90,543, a difference of 2.2%.
Median Family Income Correlation Summary
| Measurement | Immigrants from El Salvador | Iroquois |
| Minimum | $42,420 | $39,479 |
| Maximum | $127,446 | $115,891 |
| Range | $85,026 | $76,412 |
| Mean | $90,153 | $76,689 |
| Median | $92,338 | $75,795 |
| Interquartile 25% (IQ1) | $78,680 | $64,141 |
| Interquartile 75% (IQ3) | $101,462 | $85,646 |
| Interquartile Range (IQR) | $22,782 | $21,505 |
| Standard Deviation (Sample) | $16,234 | $16,973 |
| Standard Deviation (Population) | $16,143 | $16,729 |
Demographics Similar to Immigrants from El Salvador and Iroquois by Median Family Income
In terms of median family income, the demographic groups most similar to Immigrants from El Salvador are Immigrants from Guyana ($92,513, a difference of 0.030%), Immigrants from Somalia ($92,609, a difference of 0.070%), Immigrants from Barbados ($92,419, a difference of 0.14%), Immigrants from Laos ($92,239, a difference of 0.33%), and Nicaraguan ($92,231, a difference of 0.34%). Similarly, the demographic groups most similar to Iroquois are Jamaican ($90,581, a difference of 0.040%), Cree ($90,882, a difference of 0.37%), Belizean ($90,880, a difference of 0.37%), Mexican American Indian ($90,918, a difference of 0.41%), and Central American ($91,087, a difference of 0.60%).
| Demographics | Rating | Rank | Median Family Income |
| Immigrants | Somalia | 0.6 /100 | #251 | Tragic $92,609 |
| Immigrants | El Salvador | 0.6 /100 | #252 | Tragic $92,545 |
| Immigrants | Guyana | 0.6 /100 | #253 | Tragic $92,513 |
| Immigrants | Barbados | 0.5 /100 | #254 | Tragic $92,419 |
| Immigrants | Laos | 0.5 /100 | #255 | Tragic $92,239 |
| Nicaraguans | 0.5 /100 | #256 | Tragic $92,231 |
| Americans | 0.4 /100 | #257 | Tragic $92,096 |
| Osage | 0.4 /100 | #258 | Tragic $91,926 |
| Cape Verdeans | 0.4 /100 | #259 | Tragic $91,848 |
| Pennsylvania Germans | 0.4 /100 | #260 | Tragic $91,763 |
| Inupiat | 0.4 /100 | #261 | Tragic $91,730 |
| Liberians | 0.4 /100 | #262 | Tragic $91,722 |
| Immigrants | West Indies | 0.3 /100 | #263 | Tragic $91,588 |
| Senegalese | 0.3 /100 | #264 | Tragic $91,475 |
| Hmong | 0.3 /100 | #265 | Tragic $91,296 |
| Central Americans | 0.3 /100 | #266 | Tragic $91,087 |
| Mexican American Indians | 0.2 /100 | #267 | Tragic $90,918 |
| Cree | 0.2 /100 | #268 | Tragic $90,882 |
| Belizeans | 0.2 /100 | #269 | Tragic $90,880 |
| Jamaicans | 0.2 /100 | #270 | Tragic $90,581 |
| Iroquois | 0.2 /100 | #271 | Tragic $90,543 |