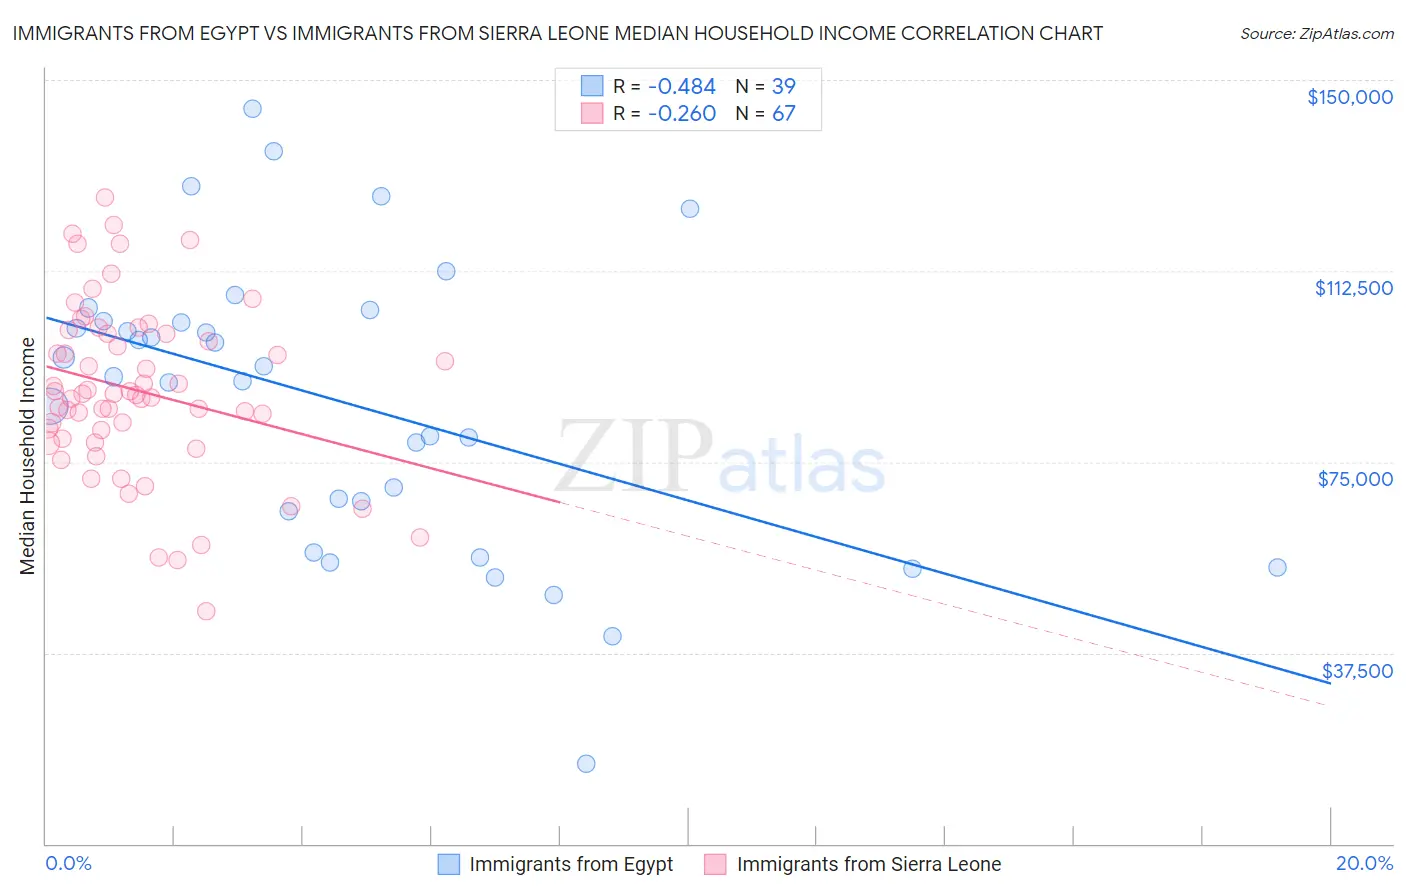
Immigrants from Egypt vs Immigrants from Sierra Leone Median Household Income
COMPARE
Immigrants from Egypt
Immigrants from Sierra Leone
Median Household Income
Median Household Income Comparison
Immigrants from Egypt
Immigrants from Sierra Leone
$93,700
MEDIAN HOUSEHOLD INCOME
99.6/ 100
METRIC RATING
73rd/ 347
METRIC RANK
$88,498
MEDIAN HOUSEHOLD INCOME
89.9/ 100
METRIC RATING
135th/ 347
METRIC RANK
Immigrants from Egypt vs Immigrants from Sierra Leone Median Household Income Correlation Chart
The statistical analysis conducted on geographies consisting of 245,403,618 people shows a moderate negative correlation between the proportion of Immigrants from Egypt and median household income in the United States with a correlation coefficient (R) of -0.484 and weighted average of $93,700. Similarly, the statistical analysis conducted on geographies consisting of 101,642,850 people shows a weak negative correlation between the proportion of Immigrants from Sierra Leone and median household income in the United States with a correlation coefficient (R) of -0.260 and weighted average of $88,498, a difference of 5.9%.
Median Household Income Correlation Summary
| Measurement | Immigrants from Egypt | Immigrants from Sierra Leone |
| Minimum | $15,682 | $45,542 |
| Maximum | $144,322 | $126,910 |
| Range | $128,640 | $81,369 |
| Mean | $86,856 | $89,050 |
| Median | $91,717 | $88,269 |
| Interquartile 25% (IQ1) | $65,358 | $79,610 |
| Interquartile 75% (IQ3) | $102,559 | $100,223 |
| Interquartile Range (IQR) | $37,201 | $20,614 |
| Standard Deviation (Sample) | $28,300 | $16,774 |
| Standard Deviation (Population) | $27,935 | $16,648 |
Similar Demographics by Median Household Income
Demographics Similar to Immigrants from Egypt by Median Household Income
In terms of median household income, the demographic groups most similar to Immigrants from Egypt are Immigrants from Latvia ($93,602, a difference of 0.10%), Lithuanian ($93,852, a difference of 0.16%), Immigrants from Philippines ($93,899, a difference of 0.21%), Immigrants from Fiji ($93,933, a difference of 0.25%), and Immigrants from Italy ($93,465, a difference of 0.25%).
| Demographics | Rating | Rank | Median Household Income |
| Immigrants | Romania | 99.7 /100 | #66 | Exceptional $94,222 |
| Immigrants | Scotland | 99.7 /100 | #67 | Exceptional $94,091 |
| Mongolians | 99.7 /100 | #68 | Exceptional $93,971 |
| Argentineans | 99.7 /100 | #69 | Exceptional $93,960 |
| Immigrants | Fiji | 99.7 /100 | #70 | Exceptional $93,933 |
| Immigrants | Philippines | 99.6 /100 | #71 | Exceptional $93,899 |
| Lithuanians | 99.6 /100 | #72 | Exceptional $93,852 |
| Immigrants | Egypt | 99.6 /100 | #73 | Exceptional $93,700 |
| Immigrants | Latvia | 99.6 /100 | #74 | Exceptional $93,602 |
| Immigrants | Italy | 99.5 /100 | #75 | Exceptional $93,465 |
| South Africans | 99.5 /100 | #76 | Exceptional $93,379 |
| Immigrants | Afghanistan | 99.5 /100 | #77 | Exceptional $93,375 |
| Immigrants | Bulgaria | 99.4 /100 | #78 | Exceptional $93,148 |
| Sri Lankans | 99.4 /100 | #79 | Exceptional $93,093 |
| Tongans | 99.4 /100 | #80 | Exceptional $93,076 |
Demographics Similar to Immigrants from Sierra Leone by Median Household Income
In terms of median household income, the demographic groups most similar to Immigrants from Sierra Leone are Swedish ($88,524, a difference of 0.030%), Polish ($88,472, a difference of 0.030%), Sierra Leonean ($88,463, a difference of 0.040%), Arab ($88,398, a difference of 0.11%), and Immigrants from Chile ($88,388, a difference of 0.12%).
| Demographics | Rating | Rank | Median Household Income |
| Portuguese | 92.3 /100 | #128 | Exceptional $88,976 |
| Brazilians | 92.1 /100 | #129 | Exceptional $88,934 |
| British | 92.0 /100 | #130 | Exceptional $88,914 |
| Immigrants | Syria | 91.4 /100 | #131 | Exceptional $88,792 |
| Europeans | 91.2 /100 | #132 | Exceptional $88,751 |
| Immigrants | Ethiopia | 90.9 /100 | #133 | Exceptional $88,687 |
| Swedes | 90.0 /100 | #134 | Exceptional $88,524 |
| Immigrants | Sierra Leone | 89.9 /100 | #135 | Excellent $88,498 |
| Poles | 89.7 /100 | #136 | Excellent $88,472 |
| Sierra Leoneans | 89.6 /100 | #137 | Excellent $88,463 |
| Arabs | 89.2 /100 | #138 | Excellent $88,398 |
| Immigrants | Chile | 89.2 /100 | #139 | Excellent $88,388 |
| Lebanese | 87.2 /100 | #140 | Excellent $88,091 |
| Immigrants | Morocco | 86.0 /100 | #141 | Excellent $87,930 |
| Canadians | 84.7 /100 | #142 | Excellent $87,769 |