Scottish vs Immigrants from Sierra Leone Median Household Income
COMPARE
Scottish
Immigrants from Sierra Leone
Median Household Income
Median Household Income Comparison
Scottish
Immigrants from Sierra Leone
$85,101
MEDIAN HOUSEHOLD INCOME
50.0/ 100
METRIC RATING
174th/ 347
METRIC RANK
$88,498
MEDIAN HOUSEHOLD INCOME
89.9/ 100
METRIC RATING
135th/ 347
METRIC RANK
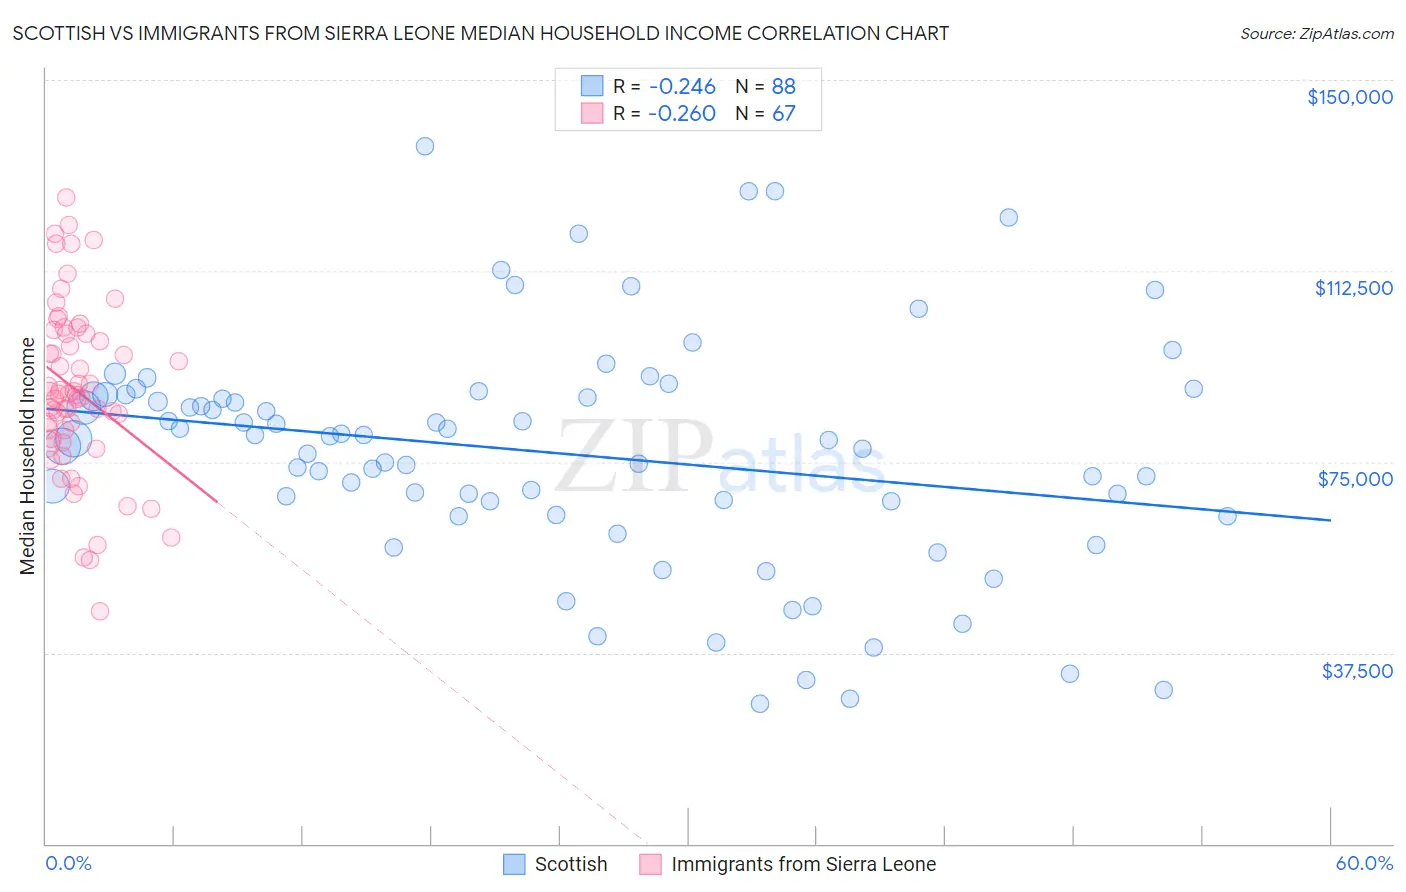
Scottish vs Immigrants from Sierra Leone Median Household Income Correlation Chart
The statistical analysis conducted on geographies consisting of 566,054,944 people shows a weak negative correlation between the proportion of Scottish and median household income in the United States with a correlation coefficient (R) of -0.246 and weighted average of $85,101. Similarly, the statistical analysis conducted on geographies consisting of 101,642,850 people shows a weak negative correlation between the proportion of Immigrants from Sierra Leone and median household income in the United States with a correlation coefficient (R) of -0.260 and weighted average of $88,498, a difference of 4.0%.
Median Household Income Correlation Summary
| Measurement | Scottish | Immigrants from Sierra Leone |
| Minimum | $27,500 | $45,542 |
| Maximum | $136,980 | $126,910 |
| Range | $109,480 | $81,369 |
| Mean | $76,735 | $89,050 |
| Median | $79,406 | $88,269 |
| Interquartile 25% (IQ1) | $65,944 | $79,610 |
| Interquartile 75% (IQ3) | $88,035 | $100,223 |
| Interquartile Range (IQR) | $22,091 | $20,614 |
| Standard Deviation (Sample) | $22,770 | $16,774 |
| Standard Deviation (Population) | $22,640 | $16,648 |
Similar Demographics by Median Household Income
Demographics Similar to Scottish by Median Household Income
In terms of median household income, the demographic groups most similar to Scottish are Immigrants from Costa Rica ($85,054, a difference of 0.050%), Alsatian ($85,053, a difference of 0.060%), Immigrants from Eritrea ($85,025, a difference of 0.090%), Czechoslovakian ($84,965, a difference of 0.16%), and English ($84,915, a difference of 0.22%).
| Demographics | Rating | Rank | Median Household Income |
| Immigrants | Immigrants | 61.3 /100 | #167 | Good $85,818 |
| Icelanders | 61.0 /100 | #168 | Good $85,797 |
| Colombians | 59.7 /100 | #169 | Average $85,716 |
| Swiss | 59.2 /100 | #170 | Average $85,681 |
| Immigrants | South America | 58.1 /100 | #171 | Average $85,611 |
| Slovenes | 57.4 /100 | #172 | Average $85,562 |
| Immigrants | Cameroon | 53.4 /100 | #173 | Average $85,314 |
| Scottish | 50.0 /100 | #174 | Average $85,101 |
| Immigrants | Costa Rica | 49.2 /100 | #175 | Average $85,054 |
| Alsatians | 49.2 /100 | #176 | Average $85,053 |
| Immigrants | Eritrea | 48.8 /100 | #177 | Average $85,025 |
| Czechoslovakians | 47.8 /100 | #178 | Average $84,965 |
| English | 47.0 /100 | #179 | Average $84,915 |
| Immigrants | Portugal | 44.2 /100 | #180 | Average $84,740 |
| Hawaiians | 44.1 /100 | #181 | Average $84,729 |
Demographics Similar to Immigrants from Sierra Leone by Median Household Income
In terms of median household income, the demographic groups most similar to Immigrants from Sierra Leone are Swedish ($88,524, a difference of 0.030%), Polish ($88,472, a difference of 0.030%), Sierra Leonean ($88,463, a difference of 0.040%), Arab ($88,398, a difference of 0.11%), and Immigrants from Chile ($88,388, a difference of 0.12%).
| Demographics | Rating | Rank | Median Household Income |
| Portuguese | 92.3 /100 | #128 | Exceptional $88,976 |
| Brazilians | 92.1 /100 | #129 | Exceptional $88,934 |
| British | 92.0 /100 | #130 | Exceptional $88,914 |
| Immigrants | Syria | 91.4 /100 | #131 | Exceptional $88,792 |
| Europeans | 91.2 /100 | #132 | Exceptional $88,751 |
| Immigrants | Ethiopia | 90.9 /100 | #133 | Exceptional $88,687 |
| Swedes | 90.0 /100 | #134 | Exceptional $88,524 |
| Immigrants | Sierra Leone | 89.9 /100 | #135 | Excellent $88,498 |
| Poles | 89.7 /100 | #136 | Excellent $88,472 |
| Sierra Leoneans | 89.6 /100 | #137 | Excellent $88,463 |
| Arabs | 89.2 /100 | #138 | Excellent $88,398 |
| Immigrants | Chile | 89.2 /100 | #139 | Excellent $88,388 |
| Lebanese | 87.2 /100 | #140 | Excellent $88,091 |
| Immigrants | Morocco | 86.0 /100 | #141 | Excellent $87,930 |
| Canadians | 84.7 /100 | #142 | Excellent $87,769 |