Immigrants from Egypt vs Belgian Median Household Income
COMPARE
Immigrants from Egypt
Belgian
Median Household Income
Median Household Income Comparison
Immigrants from Egypt
Belgians
$93,700
MEDIAN HOUSEHOLD INCOME
99.6/ 100
METRIC RATING
73rd/ 347
METRIC RANK
$84,008
MEDIAN HOUSEHOLD INCOME
33.2/ 100
METRIC RATING
187th/ 347
METRIC RANK
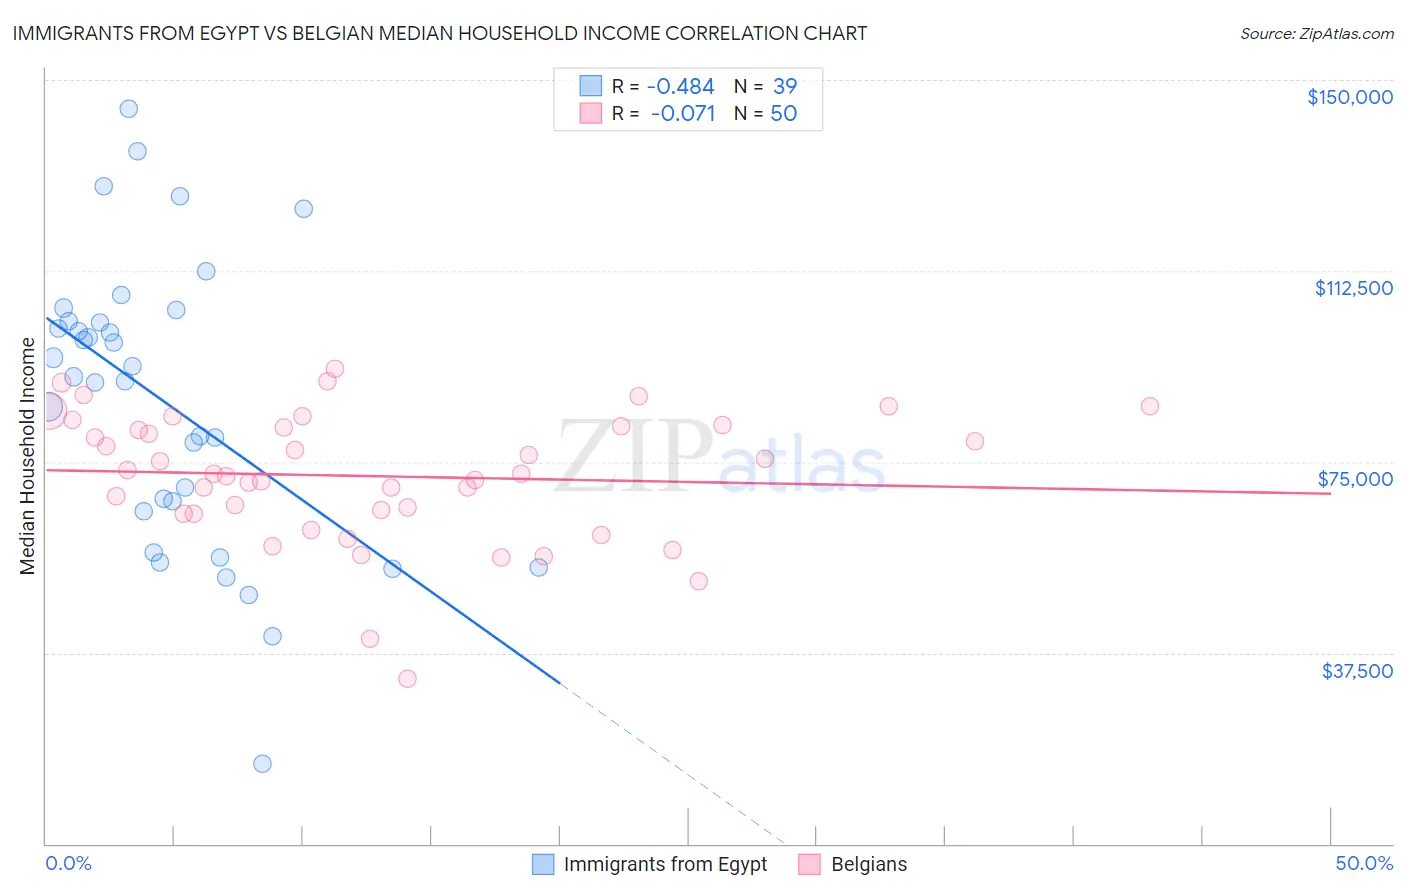
Immigrants from Egypt vs Belgian Median Household Income Correlation Chart
The statistical analysis conducted on geographies consisting of 245,403,618 people shows a moderate negative correlation between the proportion of Immigrants from Egypt and median household income in the United States with a correlation coefficient (R) of -0.484 and weighted average of $93,700. Similarly, the statistical analysis conducted on geographies consisting of 355,773,334 people shows a slight negative correlation between the proportion of Belgians and median household income in the United States with a correlation coefficient (R) of -0.071 and weighted average of $84,008, a difference of 11.5%.
Median Household Income Correlation Summary
| Measurement | Immigrants from Egypt | Belgian |
| Minimum | $15,682 | $32,500 |
| Maximum | $144,322 | $93,194 |
| Range | $128,640 | $60,694 |
| Mean | $86,856 | $72,191 |
| Median | $91,717 | $72,683 |
| Interquartile 25% (IQ1) | $65,358 | $64,851 |
| Interquartile 75% (IQ3) | $102,559 | $82,059 |
| Interquartile Range (IQR) | $37,201 | $17,208 |
| Standard Deviation (Sample) | $28,300 | $12,788 |
| Standard Deviation (Population) | $27,935 | $12,659 |
Similar Demographics by Median Household Income
Demographics Similar to Immigrants from Egypt by Median Household Income
In terms of median household income, the demographic groups most similar to Immigrants from Egypt are Immigrants from Latvia ($93,602, a difference of 0.10%), Lithuanian ($93,852, a difference of 0.16%), Immigrants from Philippines ($93,899, a difference of 0.21%), Immigrants from Fiji ($93,933, a difference of 0.25%), and Immigrants from Italy ($93,465, a difference of 0.25%).
| Demographics | Rating | Rank | Median Household Income |
| Immigrants | Romania | 99.7 /100 | #66 | Exceptional $94,222 |
| Immigrants | Scotland | 99.7 /100 | #67 | Exceptional $94,091 |
| Mongolians | 99.7 /100 | #68 | Exceptional $93,971 |
| Argentineans | 99.7 /100 | #69 | Exceptional $93,960 |
| Immigrants | Fiji | 99.7 /100 | #70 | Exceptional $93,933 |
| Immigrants | Philippines | 99.6 /100 | #71 | Exceptional $93,899 |
| Lithuanians | 99.6 /100 | #72 | Exceptional $93,852 |
| Immigrants | Egypt | 99.6 /100 | #73 | Exceptional $93,700 |
| Immigrants | Latvia | 99.6 /100 | #74 | Exceptional $93,602 |
| Immigrants | Italy | 99.5 /100 | #75 | Exceptional $93,465 |
| South Africans | 99.5 /100 | #76 | Exceptional $93,379 |
| Immigrants | Afghanistan | 99.5 /100 | #77 | Exceptional $93,375 |
| Immigrants | Bulgaria | 99.4 /100 | #78 | Exceptional $93,148 |
| Sri Lankans | 99.4 /100 | #79 | Exceptional $93,093 |
| Tongans | 99.4 /100 | #80 | Exceptional $93,076 |
Demographics Similar to Belgians by Median Household Income
In terms of median household income, the demographic groups most similar to Belgians are Puget Sound Salish ($84,011, a difference of 0.0%), Tlingit-Haida ($83,968, a difference of 0.050%), Kenyan ($84,085, a difference of 0.090%), Immigrants from Colombia ($83,902, a difference of 0.13%), and Slovak ($83,798, a difference of 0.25%).
| Demographics | Rating | Rank | Median Household Income |
| Immigrants | Portugal | 44.2 /100 | #180 | Average $84,740 |
| Hawaiians | 44.1 /100 | #181 | Average $84,729 |
| Uruguayans | 43.5 /100 | #182 | Average $84,691 |
| Spaniards | 42.7 /100 | #183 | Average $84,644 |
| Immigrants | Eastern Africa | 37.4 /100 | #184 | Fair $84,299 |
| Kenyans | 34.2 /100 | #185 | Fair $84,085 |
| Puget Sound Salish | 33.2 /100 | #186 | Fair $84,011 |
| Belgians | 33.2 /100 | #187 | Fair $84,008 |
| Tlingit-Haida | 32.6 /100 | #188 | Fair $83,968 |
| Immigrants | Colombia | 31.7 /100 | #189 | Fair $83,902 |
| Slovaks | 30.2 /100 | #190 | Fair $83,798 |
| Iraqis | 29.6 /100 | #191 | Fair $83,753 |
| Welsh | 28.0 /100 | #192 | Fair $83,628 |
| Finns | 27.7 /100 | #193 | Fair $83,607 |
| Ghanaians | 27.4 /100 | #194 | Fair $83,582 |