Liberian vs Immigrants from Sierra Leone Median Household Income
COMPARE
Liberian
Immigrants from Sierra Leone
Median Household Income
Median Household Income Comparison
Liberians
Immigrants from Sierra Leone
$75,667
MEDIAN HOUSEHOLD INCOME
0.2/ 100
METRIC RATING
273rd/ 347
METRIC RANK
$88,498
MEDIAN HOUSEHOLD INCOME
89.9/ 100
METRIC RATING
135th/ 347
METRIC RANK
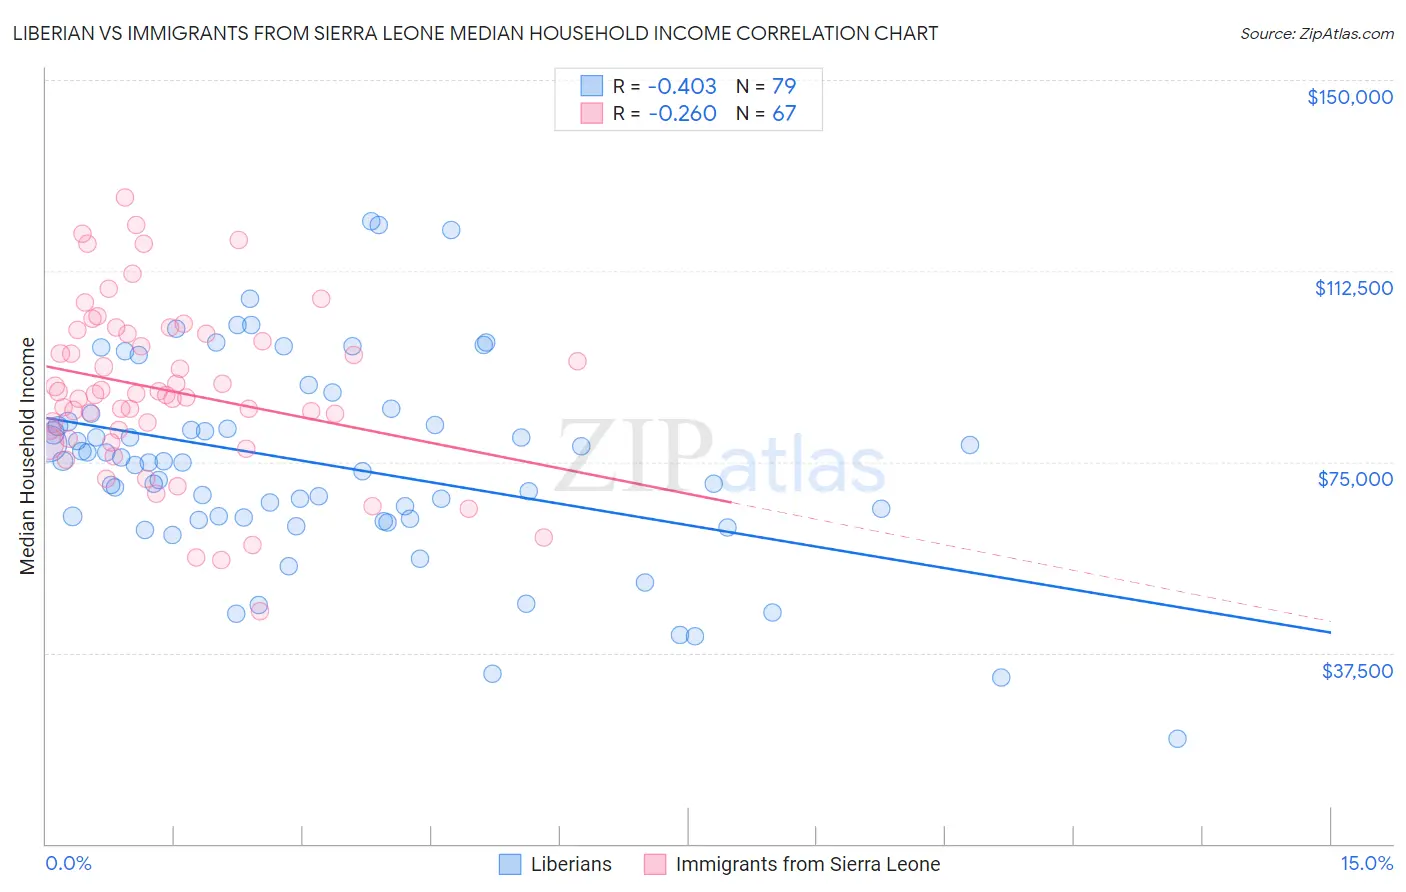
Liberian vs Immigrants from Sierra Leone Median Household Income Correlation Chart
The statistical analysis conducted on geographies consisting of 118,026,657 people shows a moderate negative correlation between the proportion of Liberians and median household income in the United States with a correlation coefficient (R) of -0.403 and weighted average of $75,667. Similarly, the statistical analysis conducted on geographies consisting of 101,642,850 people shows a weak negative correlation between the proportion of Immigrants from Sierra Leone and median household income in the United States with a correlation coefficient (R) of -0.260 and weighted average of $88,498, a difference of 17.0%.
Median Household Income Correlation Summary
| Measurement | Liberian | Immigrants from Sierra Leone |
| Minimum | $20,699 | $45,542 |
| Maximum | $122,146 | $126,910 |
| Range | $101,447 | $81,369 |
| Mean | $74,517 | $89,050 |
| Median | $74,984 | $88,269 |
| Interquartile 25% (IQ1) | $63,718 | $79,610 |
| Interquartile 75% (IQ3) | $82,932 | $100,223 |
| Interquartile Range (IQR) | $19,214 | $20,614 |
| Standard Deviation (Sample) | $19,716 | $16,774 |
| Standard Deviation (Population) | $19,591 | $16,648 |
Similar Demographics by Median Household Income
Demographics Similar to Liberians by Median Household Income
In terms of median household income, the demographic groups most similar to Liberians are British West Indian ($75,647, a difference of 0.030%), Immigrants from Micronesia ($75,574, a difference of 0.12%), Somali ($75,782, a difference of 0.15%), Pennsylvania German ($75,814, a difference of 0.19%), and Hmong ($75,839, a difference of 0.23%).
| Demographics | Rating | Rank | Median Household Income |
| Americans | 0.3 /100 | #266 | Tragic $75,932 |
| German Russians | 0.3 /100 | #267 | Tragic $75,856 |
| Immigrants | Jamaica | 0.3 /100 | #268 | Tragic $75,851 |
| Cape Verdeans | 0.3 /100 | #269 | Tragic $75,848 |
| Hmong | 0.3 /100 | #270 | Tragic $75,839 |
| Pennsylvania Germans | 0.3 /100 | #271 | Tragic $75,814 |
| Somalis | 0.3 /100 | #272 | Tragic $75,782 |
| Liberians | 0.2 /100 | #273 | Tragic $75,667 |
| British West Indians | 0.2 /100 | #274 | Tragic $75,647 |
| Immigrants | Micronesia | 0.2 /100 | #275 | Tragic $75,574 |
| Immigrants | Latin America | 0.2 /100 | #276 | Tragic $75,420 |
| Spanish Americans | 0.2 /100 | #277 | Tragic $75,386 |
| Osage | 0.2 /100 | #278 | Tragic $75,240 |
| Immigrants | Guatemala | 0.2 /100 | #279 | Tragic $75,123 |
| Senegalese | 0.2 /100 | #280 | Tragic $74,999 |
Demographics Similar to Immigrants from Sierra Leone by Median Household Income
In terms of median household income, the demographic groups most similar to Immigrants from Sierra Leone are Swedish ($88,524, a difference of 0.030%), Polish ($88,472, a difference of 0.030%), Sierra Leonean ($88,463, a difference of 0.040%), Arab ($88,398, a difference of 0.11%), and Immigrants from Chile ($88,388, a difference of 0.12%).
| Demographics | Rating | Rank | Median Household Income |
| Portuguese | 92.3 /100 | #128 | Exceptional $88,976 |
| Brazilians | 92.1 /100 | #129 | Exceptional $88,934 |
| British | 92.0 /100 | #130 | Exceptional $88,914 |
| Immigrants | Syria | 91.4 /100 | #131 | Exceptional $88,792 |
| Europeans | 91.2 /100 | #132 | Exceptional $88,751 |
| Immigrants | Ethiopia | 90.9 /100 | #133 | Exceptional $88,687 |
| Swedes | 90.0 /100 | #134 | Exceptional $88,524 |
| Immigrants | Sierra Leone | 89.9 /100 | #135 | Excellent $88,498 |
| Poles | 89.7 /100 | #136 | Excellent $88,472 |
| Sierra Leoneans | 89.6 /100 | #137 | Excellent $88,463 |
| Arabs | 89.2 /100 | #138 | Excellent $88,398 |
| Immigrants | Chile | 89.2 /100 | #139 | Excellent $88,388 |
| Lebanese | 87.2 /100 | #140 | Excellent $88,091 |
| Immigrants | Morocco | 86.0 /100 | #141 | Excellent $87,930 |
| Canadians | 84.7 /100 | #142 | Excellent $87,769 |