Dutch West Indian vs Immigrants from Sierra Leone Median Household Income
COMPARE
Dutch West Indian
Immigrants from Sierra Leone
Median Household Income
Median Household Income Comparison
Dutch West Indians
Immigrants from Sierra Leone
$68,412
MEDIAN HOUSEHOLD INCOME
0.0/ 100
METRIC RATING
329th/ 347
METRIC RANK
$88,498
MEDIAN HOUSEHOLD INCOME
89.9/ 100
METRIC RATING
135th/ 347
METRIC RANK
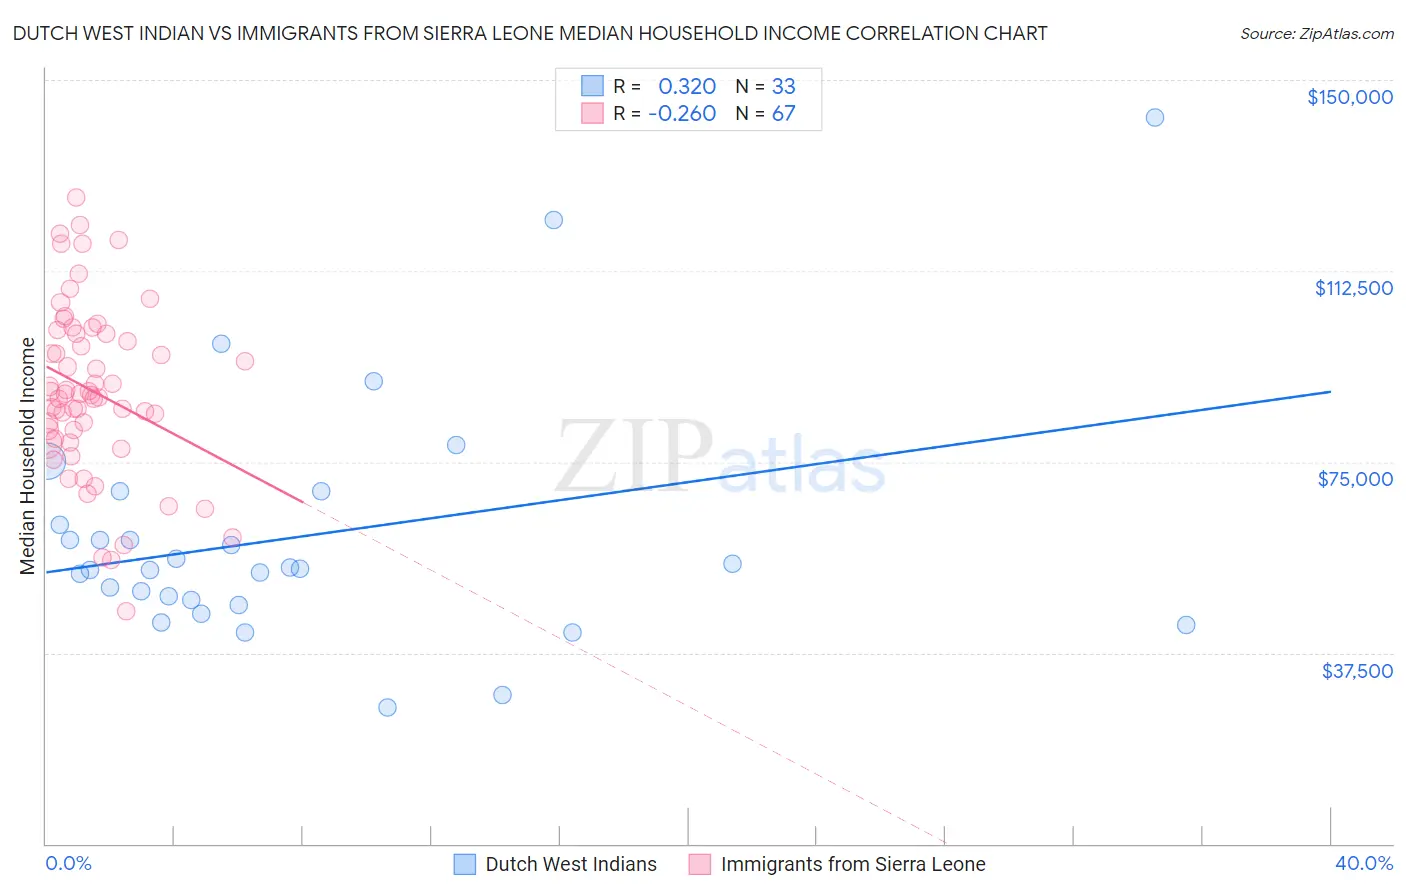
Dutch West Indian vs Immigrants from Sierra Leone Median Household Income Correlation Chart
The statistical analysis conducted on geographies consisting of 85,760,396 people shows a mild positive correlation between the proportion of Dutch West Indians and median household income in the United States with a correlation coefficient (R) of 0.320 and weighted average of $68,412. Similarly, the statistical analysis conducted on geographies consisting of 101,642,850 people shows a weak negative correlation between the proportion of Immigrants from Sierra Leone and median household income in the United States with a correlation coefficient (R) of -0.260 and weighted average of $88,498, a difference of 29.4%.
Median Household Income Correlation Summary
| Measurement | Dutch West Indian | Immigrants from Sierra Leone |
| Minimum | $26,875 | $45,542 |
| Maximum | $142,750 | $126,910 |
| Range | $115,875 | $81,369 |
| Mean | $60,408 | $89,050 |
| Median | $53,986 | $88,269 |
| Interquartile 25% (IQ1) | $47,365 | $79,610 |
| Interquartile 75% (IQ3) | $65,865 | $100,223 |
| Interquartile Range (IQR) | $18,501 | $20,614 |
| Standard Deviation (Sample) | $23,943 | $16,774 |
| Standard Deviation (Population) | $23,577 | $16,648 |
Similar Demographics by Median Household Income
Demographics Similar to Dutch West Indians by Median Household Income
In terms of median household income, the demographic groups most similar to Dutch West Indians are Menominee ($68,423, a difference of 0.020%), Immigrants from Cuba ($68,461, a difference of 0.070%), Yuman ($68,743, a difference of 0.48%), Arapaho ($67,965, a difference of 0.66%), and Native/Alaskan ($67,879, a difference of 0.79%).
| Demographics | Rating | Rank | Median Household Income |
| Choctaw | 0.0 /100 | #322 | Tragic $69,947 |
| Bahamians | 0.0 /100 | #323 | Tragic $69,726 |
| Yup'ik | 0.0 /100 | #324 | Tragic $69,695 |
| Seminole | 0.0 /100 | #325 | Tragic $69,420 |
| Yuman | 0.0 /100 | #326 | Tragic $68,743 |
| Immigrants | Cuba | 0.0 /100 | #327 | Tragic $68,461 |
| Menominee | 0.0 /100 | #328 | Tragic $68,423 |
| Dutch West Indians | 0.0 /100 | #329 | Tragic $68,412 |
| Arapaho | 0.0 /100 | #330 | Tragic $67,965 |
| Natives/Alaskans | 0.0 /100 | #331 | Tragic $67,879 |
| Sioux | 0.0 /100 | #332 | Tragic $67,792 |
| Creek | 0.0 /100 | #333 | Tragic $67,715 |
| Blacks/African Americans | 0.0 /100 | #334 | Tragic $67,573 |
| Cheyenne | 0.0 /100 | #335 | Tragic $66,974 |
| Immigrants | Congo | 0.0 /100 | #336 | Tragic $66,768 |
Demographics Similar to Immigrants from Sierra Leone by Median Household Income
In terms of median household income, the demographic groups most similar to Immigrants from Sierra Leone are Swedish ($88,524, a difference of 0.030%), Polish ($88,472, a difference of 0.030%), Sierra Leonean ($88,463, a difference of 0.040%), Arab ($88,398, a difference of 0.11%), and Immigrants from Chile ($88,388, a difference of 0.12%).
| Demographics | Rating | Rank | Median Household Income |
| Portuguese | 92.3 /100 | #128 | Exceptional $88,976 |
| Brazilians | 92.1 /100 | #129 | Exceptional $88,934 |
| British | 92.0 /100 | #130 | Exceptional $88,914 |
| Immigrants | Syria | 91.4 /100 | #131 | Exceptional $88,792 |
| Europeans | 91.2 /100 | #132 | Exceptional $88,751 |
| Immigrants | Ethiopia | 90.9 /100 | #133 | Exceptional $88,687 |
| Swedes | 90.0 /100 | #134 | Exceptional $88,524 |
| Immigrants | Sierra Leone | 89.9 /100 | #135 | Excellent $88,498 |
| Poles | 89.7 /100 | #136 | Excellent $88,472 |
| Sierra Leoneans | 89.6 /100 | #137 | Excellent $88,463 |
| Arabs | 89.2 /100 | #138 | Excellent $88,398 |
| Immigrants | Chile | 89.2 /100 | #139 | Excellent $88,388 |
| Lebanese | 87.2 /100 | #140 | Excellent $88,091 |
| Immigrants | Morocco | 86.0 /100 | #141 | Excellent $87,930 |
| Canadians | 84.7 /100 | #142 | Excellent $87,769 |