Immigrants from Egypt vs Fijian Median Household Income
COMPARE
Immigrants from Egypt
Fijian
Median Household Income
Median Household Income Comparison
Immigrants from Egypt
Fijians
$93,700
MEDIAN HOUSEHOLD INCOME
99.6/ 100
METRIC RATING
73rd/ 347
METRIC RANK
$74,205
MEDIAN HOUSEHOLD INCOME
0.1/ 100
METRIC RATING
289th/ 347
METRIC RANK
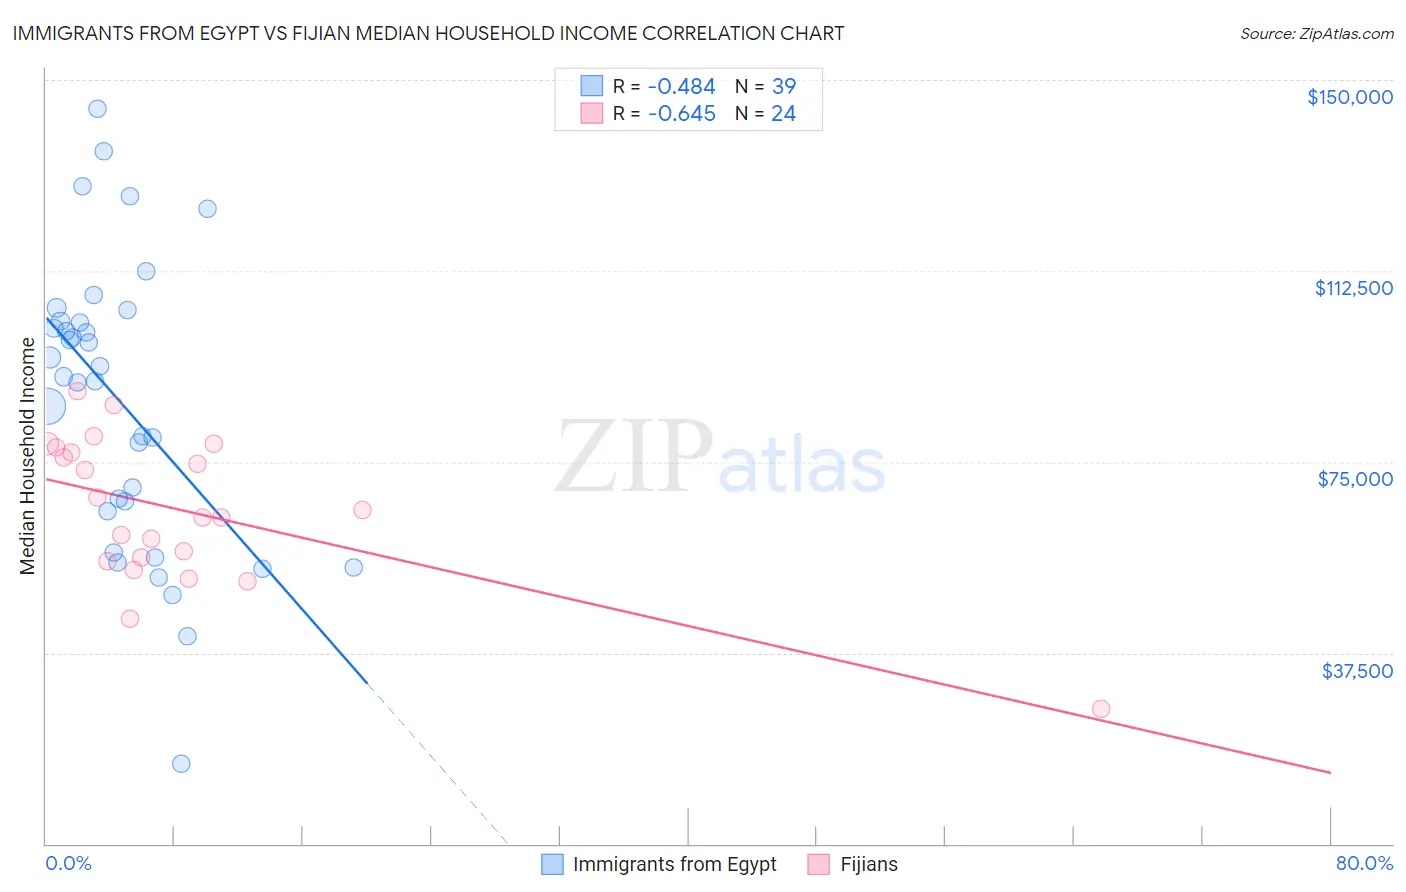
Immigrants from Egypt vs Fijian Median Household Income Correlation Chart
The statistical analysis conducted on geographies consisting of 245,403,618 people shows a moderate negative correlation between the proportion of Immigrants from Egypt and median household income in the United States with a correlation coefficient (R) of -0.484 and weighted average of $93,700. Similarly, the statistical analysis conducted on geographies consisting of 55,947,302 people shows a significant negative correlation between the proportion of Fijians and median household income in the United States with a correlation coefficient (R) of -0.645 and weighted average of $74,205, a difference of 26.3%.
Median Household Income Correlation Summary
| Measurement | Immigrants from Egypt | Fijian |
| Minimum | $15,682 | $26,558 |
| Maximum | $144,322 | $88,892 |
| Range | $128,640 | $62,334 |
| Mean | $86,856 | $65,433 |
| Median | $91,717 | $64,846 |
| Interquartile 25% (IQ1) | $65,358 | $55,875 |
| Interquartile 75% (IQ3) | $102,559 | $77,382 |
| Interquartile Range (IQR) | $37,201 | $21,507 |
| Standard Deviation (Sample) | $28,300 | $14,545 |
| Standard Deviation (Population) | $27,935 | $14,239 |
Similar Demographics by Median Household Income
Demographics Similar to Immigrants from Egypt by Median Household Income
In terms of median household income, the demographic groups most similar to Immigrants from Egypt are Immigrants from Latvia ($93,602, a difference of 0.10%), Lithuanian ($93,852, a difference of 0.16%), Immigrants from Philippines ($93,899, a difference of 0.21%), Immigrants from Fiji ($93,933, a difference of 0.25%), and Immigrants from Italy ($93,465, a difference of 0.25%).
| Demographics | Rating | Rank | Median Household Income |
| Immigrants | Romania | 99.7 /100 | #66 | Exceptional $94,222 |
| Immigrants | Scotland | 99.7 /100 | #67 | Exceptional $94,091 |
| Mongolians | 99.7 /100 | #68 | Exceptional $93,971 |
| Argentineans | 99.7 /100 | #69 | Exceptional $93,960 |
| Immigrants | Fiji | 99.7 /100 | #70 | Exceptional $93,933 |
| Immigrants | Philippines | 99.6 /100 | #71 | Exceptional $93,899 |
| Lithuanians | 99.6 /100 | #72 | Exceptional $93,852 |
| Immigrants | Egypt | 99.6 /100 | #73 | Exceptional $93,700 |
| Immigrants | Latvia | 99.6 /100 | #74 | Exceptional $93,602 |
| Immigrants | Italy | 99.5 /100 | #75 | Exceptional $93,465 |
| South Africans | 99.5 /100 | #76 | Exceptional $93,379 |
| Immigrants | Afghanistan | 99.5 /100 | #77 | Exceptional $93,375 |
| Immigrants | Bulgaria | 99.4 /100 | #78 | Exceptional $93,148 |
| Sri Lankans | 99.4 /100 | #79 | Exceptional $93,093 |
| Tongans | 99.4 /100 | #80 | Exceptional $93,076 |
Demographics Similar to Fijians by Median Household Income
In terms of median household income, the demographic groups most similar to Fijians are Immigrants from Central America ($74,217, a difference of 0.020%), Iroquois ($74,279, a difference of 0.10%), Immigrants from Somalia ($74,300, a difference of 0.13%), Bangladeshi ($74,112, a difference of 0.13%), and Mexican ($74,399, a difference of 0.26%).
| Demographics | Rating | Rank | Median Household Income |
| Central American Indians | 0.1 /100 | #282 | Tragic $74,847 |
| Cree | 0.1 /100 | #283 | Tragic $74,685 |
| Yaqui | 0.1 /100 | #284 | Tragic $74,596 |
| Mexicans | 0.1 /100 | #285 | Tragic $74,399 |
| Immigrants | Somalia | 0.1 /100 | #286 | Tragic $74,300 |
| Iroquois | 0.1 /100 | #287 | Tragic $74,279 |
| Immigrants | Central America | 0.1 /100 | #288 | Tragic $74,217 |
| Fijians | 0.1 /100 | #289 | Tragic $74,205 |
| Bangladeshis | 0.1 /100 | #290 | Tragic $74,112 |
| Hispanics or Latinos | 0.1 /100 | #291 | Tragic $73,823 |
| Comanche | 0.1 /100 | #292 | Tragic $73,747 |
| Immigrants | Cabo Verde | 0.1 /100 | #293 | Tragic $73,515 |
| Blackfeet | 0.1 /100 | #294 | Tragic $73,509 |
| Cubans | 0.1 /100 | #295 | Tragic $73,392 |
| Haitians | 0.1 /100 | #296 | Tragic $73,306 |