Immigrants from Egypt vs Immigrants from Germany Householder Income Ages 45 - 64 years
COMPARE
Immigrants from Egypt
Immigrants from Germany
Householder Income Ages 45 - 64 years
Householder Income Ages 45 - 64 years Comparison
Immigrants from Egypt
Immigrants from Germany
$109,941
HOUSEHOLDER INCOME AGES 45 - 64 YEARS
99.2/ 100
METRIC RATING
74th/ 347
METRIC RANK
$103,282
HOUSEHOLDER INCOME AGES 45 - 64 YEARS
81.5/ 100
METRIC RATING
148th/ 347
METRIC RANK
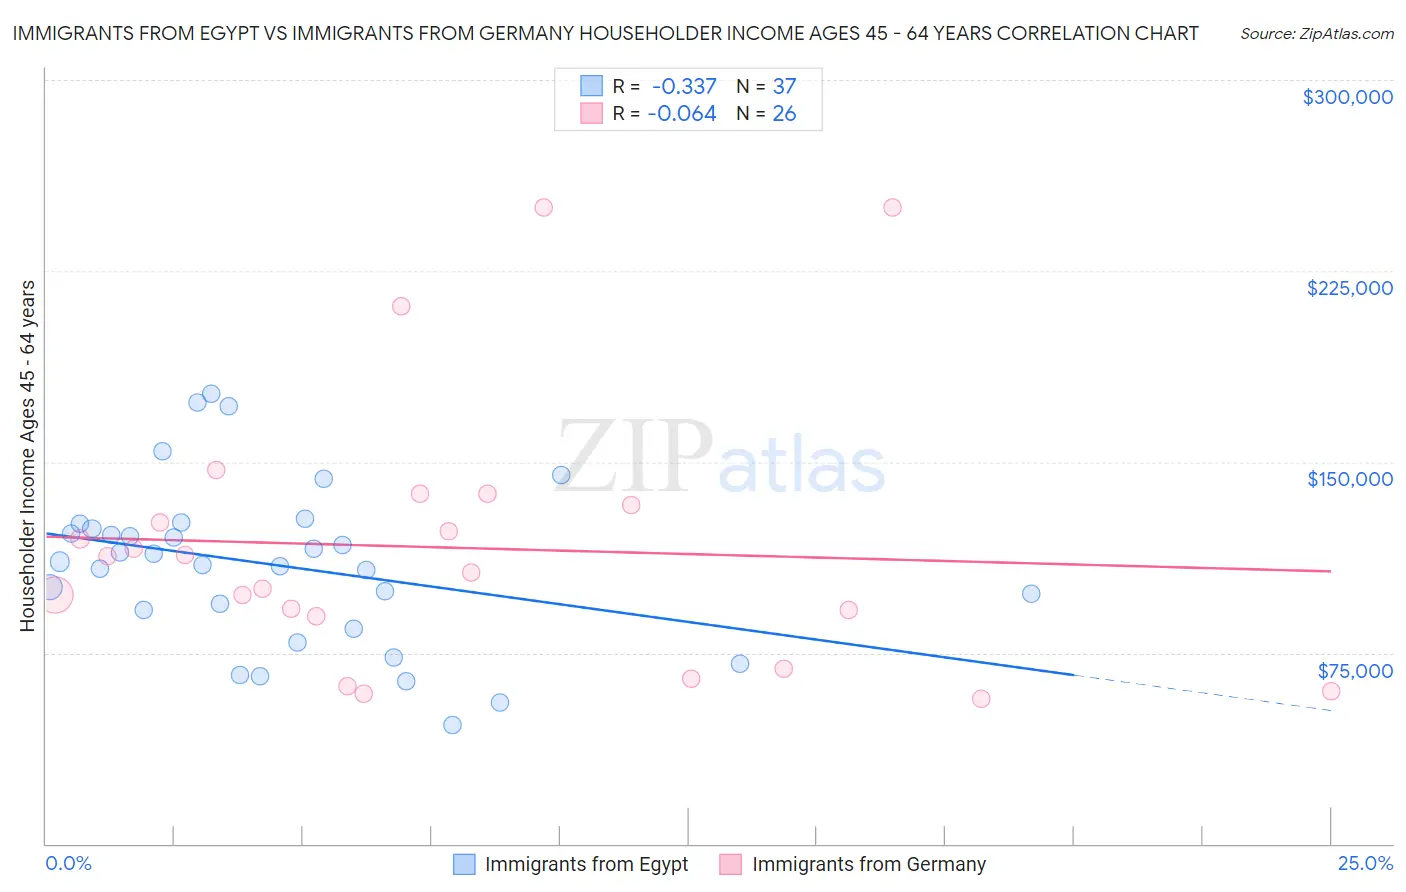
Immigrants from Egypt vs Immigrants from Germany Householder Income Ages 45 - 64 years Correlation Chart
The statistical analysis conducted on geographies consisting of 245,345,786 people shows a mild negative correlation between the proportion of Immigrants from Egypt and household income with householder between the ages 45 and 64 in the United States with a correlation coefficient (R) of -0.337 and weighted average of $109,941. Similarly, the statistical analysis conducted on geographies consisting of 463,046,856 people shows a slight negative correlation between the proportion of Immigrants from Germany and household income with householder between the ages 45 and 64 in the United States with a correlation coefficient (R) of -0.064 and weighted average of $103,282, a difference of 6.5%.
Householder Income Ages 45 - 64 years Correlation Summary
| Measurement | Immigrants from Egypt | Immigrants from Germany |
| Minimum | $46,773 | $56,731 |
| Maximum | $176,674 | $250,001 |
| Range | $129,901 | $193,270 |
| Mean | $109,415 | $116,317 |
| Median | $110,780 | $109,777 |
| Interquartile 25% (IQ1) | $88,195 | $89,417 |
| Interquartile 75% (IQ3) | $124,792 | $133,088 |
| Interquartile Range (IQR) | $36,597 | $43,671 |
| Standard Deviation (Sample) | $31,863 | $52,104 |
| Standard Deviation (Population) | $31,429 | $51,092 |
Similar Demographics by Householder Income Ages 45 - 64 years
Demographics Similar to Immigrants from Egypt by Householder Income Ages 45 - 64 years
In terms of householder income ages 45 - 64 years, the demographic groups most similar to Immigrants from Egypt are Argentinean ($110,103, a difference of 0.15%), South African ($109,719, a difference of 0.20%), Assyrian/Chaldean/Syriac ($110,201, a difference of 0.24%), Italian ($110,224, a difference of 0.26%), and Korean ($110,334, a difference of 0.36%).
| Demographics | Rating | Rank | Householder Income Ages 45 - 64 years |
| Laotians | 99.5 /100 | #67 | Exceptional $111,051 |
| Immigrants | Romania | 99.4 /100 | #68 | Exceptional $110,633 |
| Immigrants | Italy | 99.4 /100 | #69 | Exceptional $110,434 |
| Koreans | 99.3 /100 | #70 | Exceptional $110,334 |
| Italians | 99.3 /100 | #71 | Exceptional $110,224 |
| Assyrians/Chaldeans/Syriacs | 99.3 /100 | #72 | Exceptional $110,201 |
| Argentineans | 99.3 /100 | #73 | Exceptional $110,103 |
| Immigrants | Egypt | 99.2 /100 | #74 | Exceptional $109,941 |
| South Africans | 99.1 /100 | #75 | Exceptional $109,719 |
| Paraguayans | 99.0 /100 | #76 | Exceptional $109,447 |
| Immigrants | England | 99.0 /100 | #77 | Exceptional $109,446 |
| Immigrants | Canada | 99.0 /100 | #78 | Exceptional $109,402 |
| Immigrants | Bulgaria | 98.9 /100 | #79 | Exceptional $109,379 |
| Jordanians | 98.9 /100 | #80 | Exceptional $109,376 |
| Immigrants | Eastern Europe | 98.9 /100 | #81 | Exceptional $109,335 |
Demographics Similar to Immigrants from Germany by Householder Income Ages 45 - 64 years
In terms of householder income ages 45 - 64 years, the demographic groups most similar to Immigrants from Germany are Immigrants from Sierra Leone ($103,227, a difference of 0.050%), Basque ($103,387, a difference of 0.10%), Immigrants from Peru ($103,173, a difference of 0.11%), Immigrants from Chile ($103,412, a difference of 0.13%), and Ugandan ($103,472, a difference of 0.18%).
| Demographics | Rating | Rank | Householder Income Ages 45 - 64 years |
| Immigrants | Uganda | 83.7 /100 | #141 | Excellent $103,584 |
| Luxembourgers | 83.3 /100 | #142 | Excellent $103,536 |
| Serbians | 83.2 /100 | #143 | Excellent $103,522 |
| Czechs | 83.1 /100 | #144 | Excellent $103,507 |
| Ugandans | 82.9 /100 | #145 | Excellent $103,472 |
| Immigrants | Chile | 82.5 /100 | #146 | Excellent $103,412 |
| Basques | 82.3 /100 | #147 | Excellent $103,387 |
| Immigrants | Germany | 81.5 /100 | #148 | Excellent $103,282 |
| Immigrants | Sierra Leone | 81.1 /100 | #149 | Excellent $103,227 |
| Immigrants | Peru | 80.7 /100 | #150 | Excellent $103,173 |
| Swiss | 79.9 /100 | #151 | Good $103,071 |
| Irish | 79.8 /100 | #152 | Good $103,067 |
| Scandinavians | 79.0 /100 | #153 | Good $102,969 |
| Slovenes | 78.3 /100 | #154 | Good $102,885 |
| Costa Ricans | 77.4 /100 | #155 | Good $102,779 |