Immigrants from Serbia vs Immigrants from Malaysia Householder Income Ages 45 - 64 years
COMPARE
Immigrants from Serbia
Immigrants from Malaysia
Householder Income Ages 45 - 64 years
Householder Income Ages 45 - 64 years Comparison
Immigrants from Serbia
Immigrants from Malaysia
$107,569
HOUSEHOLDER INCOME AGES 45 - 64 YEARS
97.4/ 100
METRIC RATING
100th/ 347
METRIC RANK
$112,796
HOUSEHOLDER INCOME AGES 45 - 64 YEARS
99.8/ 100
METRIC RATING
52nd/ 347
METRIC RANK
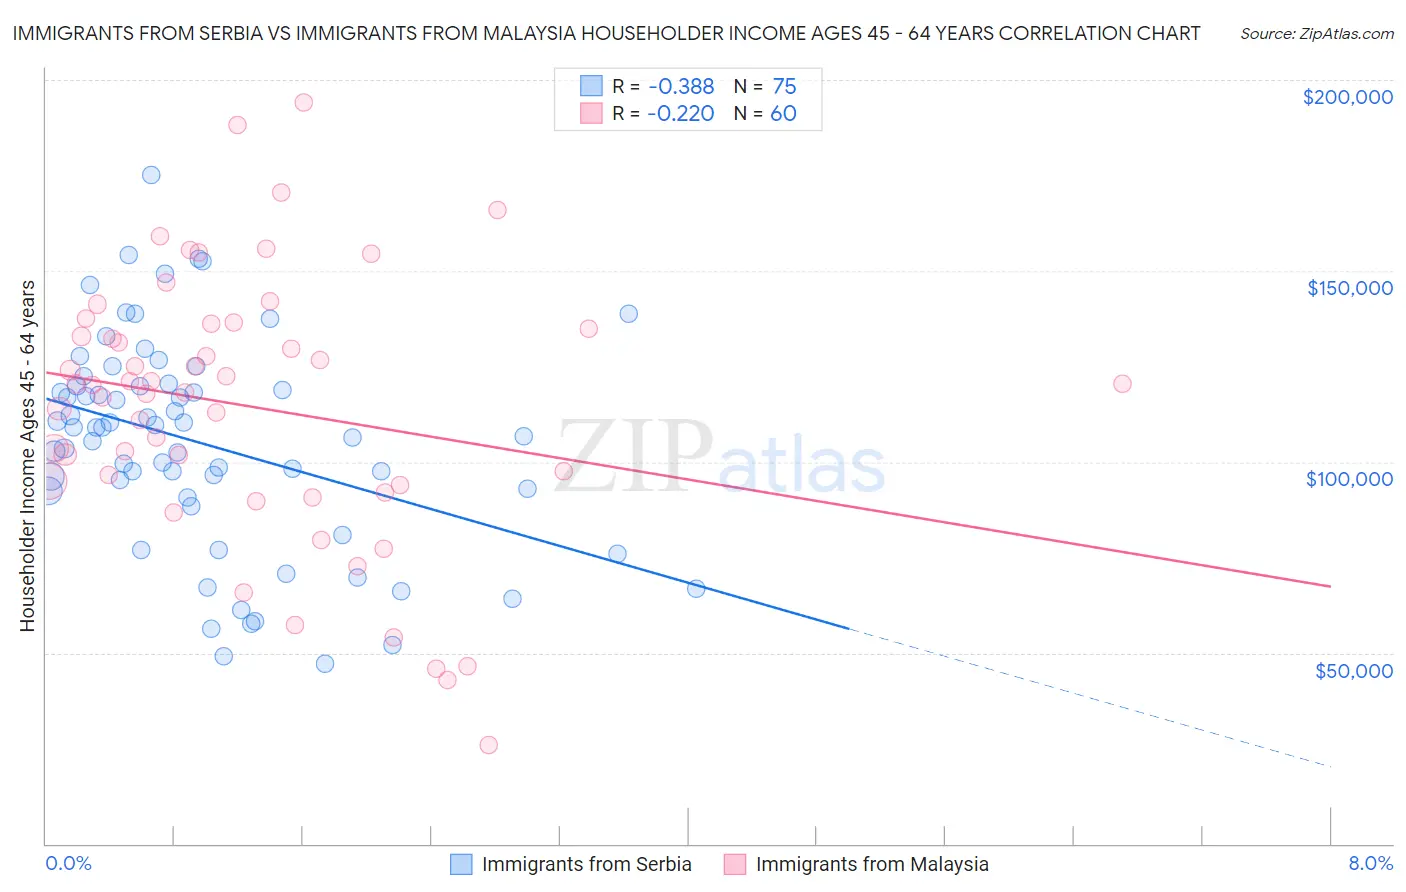
Immigrants from Serbia vs Immigrants from Malaysia Householder Income Ages 45 - 64 years Correlation Chart
The statistical analysis conducted on geographies consisting of 131,681,242 people shows a mild negative correlation between the proportion of Immigrants from Serbia and household income with householder between the ages 45 and 64 in the United States with a correlation coefficient (R) of -0.388 and weighted average of $107,569. Similarly, the statistical analysis conducted on geographies consisting of 197,847,367 people shows a weak negative correlation between the proportion of Immigrants from Malaysia and household income with householder between the ages 45 and 64 in the United States with a correlation coefficient (R) of -0.220 and weighted average of $112,796, a difference of 4.9%.
Householder Income Ages 45 - 64 years Correlation Summary
| Measurement | Immigrants from Serbia | Immigrants from Malaysia |
| Minimum | $47,000 | $25,952 |
| Maximum | $175,247 | $194,219 |
| Range | $128,247 | $168,267 |
| Mean | $104,599 | $114,501 |
| Median | $108,917 | $120,322 |
| Interquartile 25% (IQ1) | $90,676 | $94,457 |
| Interquartile 75% (IQ3) | $119,792 | $135,508 |
| Interquartile Range (IQR) | $29,116 | $41,051 |
| Standard Deviation (Sample) | $27,672 | $35,239 |
| Standard Deviation (Population) | $27,487 | $34,945 |
Similar Demographics by Householder Income Ages 45 - 64 years
Demographics Similar to Immigrants from Serbia by Householder Income Ages 45 - 64 years
In terms of householder income ages 45 - 64 years, the demographic groups most similar to Immigrants from Serbia are Palestinian ($107,721, a difference of 0.14%), Immigrants from Kazakhstan ($107,378, a difference of 0.18%), Immigrants from Southern Europe ($107,775, a difference of 0.19%), Immigrants from Moldova ($107,357, a difference of 0.20%), and Northern European ($107,870, a difference of 0.28%).
| Demographics | Rating | Rank | Householder Income Ages 45 - 64 years |
| Immigrants | Croatia | 98.2 /100 | #93 | Exceptional $108,304 |
| Sri Lankans | 98.2 /100 | #94 | Exceptional $108,270 |
| Immigrants | Hungary | 98.2 /100 | #95 | Exceptional $108,267 |
| Immigrants | Argentina | 98.2 /100 | #96 | Exceptional $108,264 |
| Northern Europeans | 97.8 /100 | #97 | Exceptional $107,870 |
| Immigrants | Southern Europe | 97.7 /100 | #98 | Exceptional $107,775 |
| Palestinians | 97.6 /100 | #99 | Exceptional $107,721 |
| Immigrants | Serbia | 97.4 /100 | #100 | Exceptional $107,569 |
| Immigrants | Kazakhstan | 97.2 /100 | #101 | Exceptional $107,378 |
| Immigrants | Moldova | 97.1 /100 | #102 | Exceptional $107,357 |
| Syrians | 96.9 /100 | #103 | Exceptional $107,207 |
| Immigrants | Ukraine | 96.7 /100 | #104 | Exceptional $107,079 |
| Macedonians | 96.7 /100 | #105 | Exceptional $107,074 |
| Armenians | 96.6 /100 | #106 | Exceptional $107,002 |
| Immigrants | Fiji | 96.5 /100 | #107 | Exceptional $106,952 |
Demographics Similar to Immigrants from Malaysia by Householder Income Ages 45 - 64 years
In terms of householder income ages 45 - 64 years, the demographic groups most similar to Immigrants from Malaysia are Immigrants from South Africa ($112,886, a difference of 0.080%), Afghan ($112,676, a difference of 0.11%), Greek ($112,630, a difference of 0.15%), Lithuanian ($112,484, a difference of 0.28%), and Immigrants from Austria ($113,140, a difference of 0.30%).
| Demographics | Rating | Rank | Householder Income Ages 45 - 64 years |
| Immigrants | France | 99.9 /100 | #45 | Exceptional $113,680 |
| Immigrants | Greece | 99.9 /100 | #46 | Exceptional $113,548 |
| Australians | 99.9 /100 | #47 | Exceptional $113,533 |
| Immigrants | Indonesia | 99.9 /100 | #48 | Exceptional $113,519 |
| Immigrants | Russia | 99.8 /100 | #49 | Exceptional $113,215 |
| Immigrants | Austria | 99.8 /100 | #50 | Exceptional $113,140 |
| Immigrants | South Africa | 99.8 /100 | #51 | Exceptional $112,886 |
| Immigrants | Malaysia | 99.8 /100 | #52 | Exceptional $112,796 |
| Afghans | 99.8 /100 | #53 | Exceptional $112,676 |
| Greeks | 99.8 /100 | #54 | Exceptional $112,630 |
| Lithuanians | 99.8 /100 | #55 | Exceptional $112,484 |
| Egyptians | 99.7 /100 | #56 | Exceptional $112,256 |
| Immigrants | Scotland | 99.7 /100 | #57 | Exceptional $112,175 |
| Soviet Union | 99.7 /100 | #58 | Exceptional $112,008 |
| Immigrants | Europe | 99.7 /100 | #59 | Exceptional $111,984 |