Immigrants from Egypt vs Sri Lankan Householder Income Ages 45 - 64 years
COMPARE
Immigrants from Egypt
Sri Lankan
Householder Income Ages 45 - 64 years
Householder Income Ages 45 - 64 years Comparison
Immigrants from Egypt
Sri Lankans
$109,941
HOUSEHOLDER INCOME AGES 45 - 64 YEARS
99.2/ 100
METRIC RATING
74th/ 347
METRIC RANK
$108,270
HOUSEHOLDER INCOME AGES 45 - 64 YEARS
98.2/ 100
METRIC RATING
94th/ 347
METRIC RANK
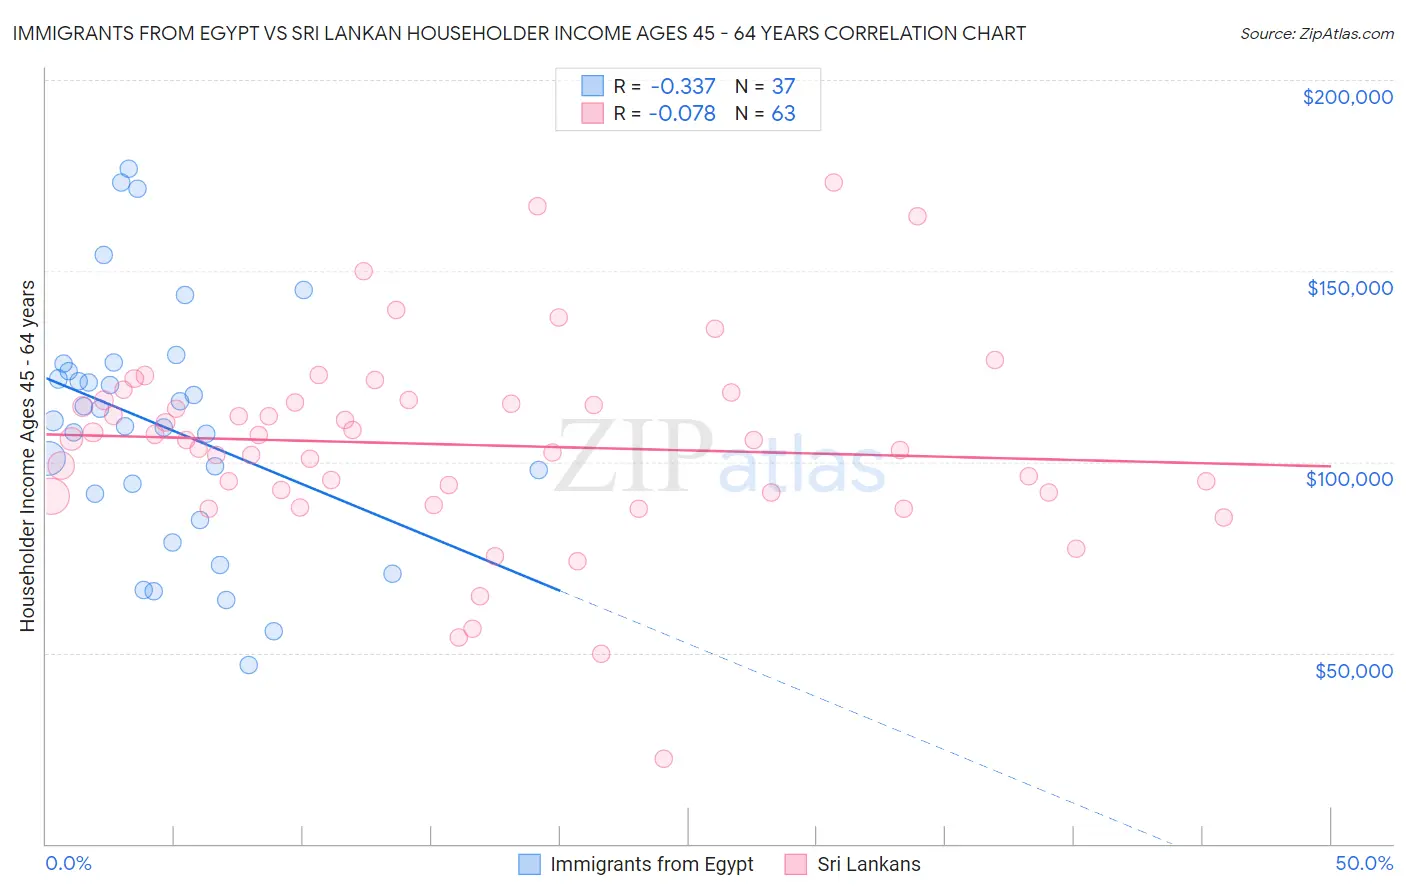
Immigrants from Egypt vs Sri Lankan Householder Income Ages 45 - 64 years Correlation Chart
The statistical analysis conducted on geographies consisting of 245,345,786 people shows a mild negative correlation between the proportion of Immigrants from Egypt and household income with householder between the ages 45 and 64 in the United States with a correlation coefficient (R) of -0.337 and weighted average of $109,941. Similarly, the statistical analysis conducted on geographies consisting of 439,428,647 people shows a slight negative correlation between the proportion of Sri Lankans and household income with householder between the ages 45 and 64 in the United States with a correlation coefficient (R) of -0.078 and weighted average of $108,270, a difference of 1.5%.
Householder Income Ages 45 - 64 years Correlation Summary
| Measurement | Immigrants from Egypt | Sri Lankan |
| Minimum | $46,773 | $22,321 |
| Maximum | $176,674 | $173,169 |
| Range | $129,901 | $150,848 |
| Mean | $109,415 | $104,535 |
| Median | $110,780 | $105,686 |
| Interquartile 25% (IQ1) | $88,195 | $91,849 |
| Interquartile 75% (IQ3) | $124,792 | $116,139 |
| Interquartile Range (IQR) | $36,597 | $24,290 |
| Standard Deviation (Sample) | $31,863 | $26,133 |
| Standard Deviation (Population) | $31,429 | $25,925 |
Demographics Similar to Immigrants from Egypt and Sri Lankans by Householder Income Ages 45 - 64 years
In terms of householder income ages 45 - 64 years, the demographic groups most similar to Immigrants from Egypt are South African ($109,719, a difference of 0.20%), Paraguayan ($109,447, a difference of 0.45%), Immigrants from England ($109,446, a difference of 0.45%), Immigrants from Canada ($109,402, a difference of 0.49%), and Immigrants from Bulgaria ($109,379, a difference of 0.51%). Similarly, the demographic groups most similar to Sri Lankans are Immigrants from Croatia ($108,304, a difference of 0.030%), Croatian ($108,383, a difference of 0.10%), Ukrainian ($108,475, a difference of 0.19%), Immigrants from Philippines ($108,471, a difference of 0.19%), and Immigrants from Lebanon ($108,471, a difference of 0.19%).
| Demographics | Rating | Rank | Householder Income Ages 45 - 64 years |
| Immigrants | Egypt | 99.2 /100 | #74 | Exceptional $109,941 |
| South Africans | 99.1 /100 | #75 | Exceptional $109,719 |
| Paraguayans | 99.0 /100 | #76 | Exceptional $109,447 |
| Immigrants | England | 99.0 /100 | #77 | Exceptional $109,446 |
| Immigrants | Canada | 99.0 /100 | #78 | Exceptional $109,402 |
| Immigrants | Bulgaria | 98.9 /100 | #79 | Exceptional $109,379 |
| Jordanians | 98.9 /100 | #80 | Exceptional $109,376 |
| Immigrants | Eastern Europe | 98.9 /100 | #81 | Exceptional $109,335 |
| Immigrants | North America | 98.8 /100 | #82 | Exceptional $109,198 |
| Immigrants | Spain | 98.8 /100 | #83 | Exceptional $109,051 |
| Immigrants | Western Europe | 98.6 /100 | #84 | Exceptional $108,824 |
| Immigrants | Afghanistan | 98.6 /100 | #85 | Exceptional $108,785 |
| Austrians | 98.5 /100 | #86 | Exceptional $108,692 |
| Tongans | 98.5 /100 | #87 | Exceptional $108,643 |
| Romanians | 98.5 /100 | #88 | Exceptional $108,609 |
| Ukrainians | 98.3 /100 | #89 | Exceptional $108,475 |
| Immigrants | Philippines | 98.3 /100 | #90 | Exceptional $108,471 |
| Immigrants | Lebanon | 98.3 /100 | #91 | Exceptional $108,471 |
| Croatians | 98.3 /100 | #92 | Exceptional $108,383 |
| Immigrants | Croatia | 98.2 /100 | #93 | Exceptional $108,304 |
| Sri Lankans | 98.2 /100 | #94 | Exceptional $108,270 |