Immigrants from Eastern Europe vs Chinese Per Capita Income
COMPARE
Immigrants from Eastern Europe
Chinese
Per Capita Income
Per Capita Income Comparison
Immigrants from Eastern Europe
Chinese
$49,316
PER CAPITA INCOME
99.8/ 100
METRIC RATING
70th/ 347
METRIC RANK
$46,098
PER CAPITA INCOME
93.9/ 100
METRIC RATING
117th/ 347
METRIC RANK
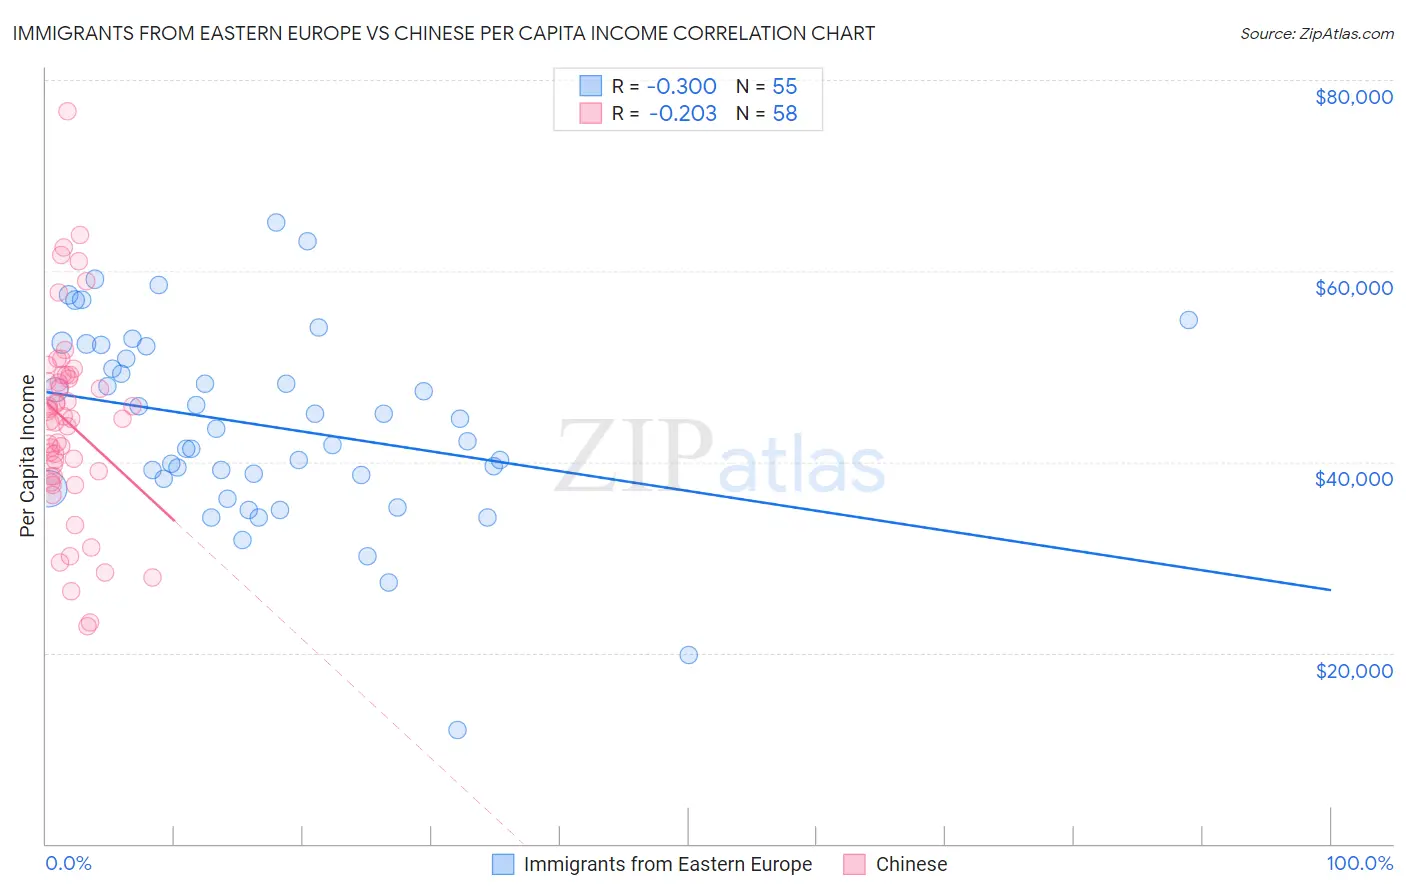
Immigrants from Eastern Europe vs Chinese Per Capita Income Correlation Chart
The statistical analysis conducted on geographies consisting of 475,909,119 people shows a mild negative correlation between the proportion of Immigrants from Eastern Europe and per capita income in the United States with a correlation coefficient (R) of -0.300 and weighted average of $49,316. Similarly, the statistical analysis conducted on geographies consisting of 64,809,125 people shows a weak negative correlation between the proportion of Chinese and per capita income in the United States with a correlation coefficient (R) of -0.203 and weighted average of $46,098, a difference of 7.0%.
Per Capita Income Correlation Summary
| Measurement | Immigrants from Eastern Europe | Chinese |
| Minimum | $11,876 | $22,765 |
| Maximum | $65,115 | $76,789 |
| Range | $53,239 | $54,024 |
| Mean | $43,803 | $44,105 |
| Median | $43,497 | $44,514 |
| Interquartile 25% (IQ1) | $38,232 | $38,432 |
| Interquartile 75% (IQ3) | $52,105 | $49,089 |
| Interquartile Range (IQR) | $13,872 | $10,657 |
| Standard Deviation (Sample) | $10,236 | $10,226 |
| Standard Deviation (Population) | $10,143 | $10,137 |
Similar Demographics by Per Capita Income
Demographics Similar to Immigrants from Eastern Europe by Per Capita Income
In terms of per capita income, the demographic groups most similar to Immigrants from Eastern Europe are Greek ($49,309, a difference of 0.010%), Immigrants from Hungary ($49,303, a difference of 0.030%), Immigrants from North America ($49,302, a difference of 0.030%), Immigrants from Canada ($49,412, a difference of 0.20%), and Lithuanian ($49,448, a difference of 0.27%).
| Demographics | Rating | Rank | Per Capita Income |
| Maltese | 99.9 /100 | #63 | Exceptional $49,640 |
| Immigrants | Argentina | 99.9 /100 | #64 | Exceptional $49,627 |
| Bolivians | 99.9 /100 | #65 | Exceptional $49,526 |
| Immigrants | Bulgaria | 99.9 /100 | #66 | Exceptional $49,482 |
| Immigrants | Romania | 99.9 /100 | #67 | Exceptional $49,463 |
| Lithuanians | 99.8 /100 | #68 | Exceptional $49,448 |
| Immigrants | Canada | 99.8 /100 | #69 | Exceptional $49,412 |
| Immigrants | Eastern Europe | 99.8 /100 | #70 | Exceptional $49,316 |
| Greeks | 99.8 /100 | #71 | Exceptional $49,309 |
| Immigrants | Hungary | 99.8 /100 | #72 | Exceptional $49,303 |
| Immigrants | North America | 99.8 /100 | #73 | Exceptional $49,302 |
| Mongolians | 99.8 /100 | #74 | Exceptional $49,173 |
| Immigrants | Bolivia | 99.7 /100 | #75 | Exceptional $48,970 |
| Immigrants | England | 99.7 /100 | #76 | Exceptional $48,844 |
| Immigrants | Kazakhstan | 99.7 /100 | #77 | Exceptional $48,747 |
Demographics Similar to Chinese by Per Capita Income
In terms of per capita income, the demographic groups most similar to Chinese are Polish ($46,123, a difference of 0.050%), Immigrants from Saudi Arabia ($46,008, a difference of 0.19%), Immigrants from Chile ($46,213, a difference of 0.25%), Immigrants from Poland ($45,979, a difference of 0.26%), and Afghan ($46,268, a difference of 0.37%).
| Demographics | Rating | Rank | Per Capita Income |
| Chileans | 95.9 /100 | #110 | Exceptional $46,459 |
| Taiwanese | 95.8 /100 | #111 | Exceptional $46,455 |
| Immigrants | Morocco | 95.7 /100 | #112 | Exceptional $46,430 |
| Immigrants | Albania | 95.5 /100 | #113 | Exceptional $46,387 |
| Afghans | 94.9 /100 | #114 | Exceptional $46,268 |
| Immigrants | Chile | 94.6 /100 | #115 | Exceptional $46,213 |
| Poles | 94.1 /100 | #116 | Exceptional $46,123 |
| Chinese | 93.9 /100 | #117 | Exceptional $46,098 |
| Immigrants | Saudi Arabia | 93.3 /100 | #118 | Exceptional $46,008 |
| Immigrants | Poland | 93.1 /100 | #119 | Exceptional $45,979 |
| Immigrants | Ethiopia | 92.7 /100 | #120 | Exceptional $45,923 |
| Canadians | 92.2 /100 | #121 | Exceptional $45,858 |
| Moroccans | 92.1 /100 | #122 | Exceptional $45,854 |
| Lebanese | 92.0 /100 | #123 | Exceptional $45,840 |
| Europeans | 92.0 /100 | #124 | Exceptional $45,836 |