Immigrants from Eastern Europe vs Kenyan Per Capita Income
COMPARE
Immigrants from Eastern Europe
Kenyan
Per Capita Income
Per Capita Income Comparison
Immigrants from Eastern Europe
Kenyans
$49,316
PER CAPITA INCOME
99.8/ 100
METRIC RATING
70th/ 347
METRIC RANK
$42,808
PER CAPITA INCOME
27.7/ 100
METRIC RATING
190th/ 347
METRIC RANK
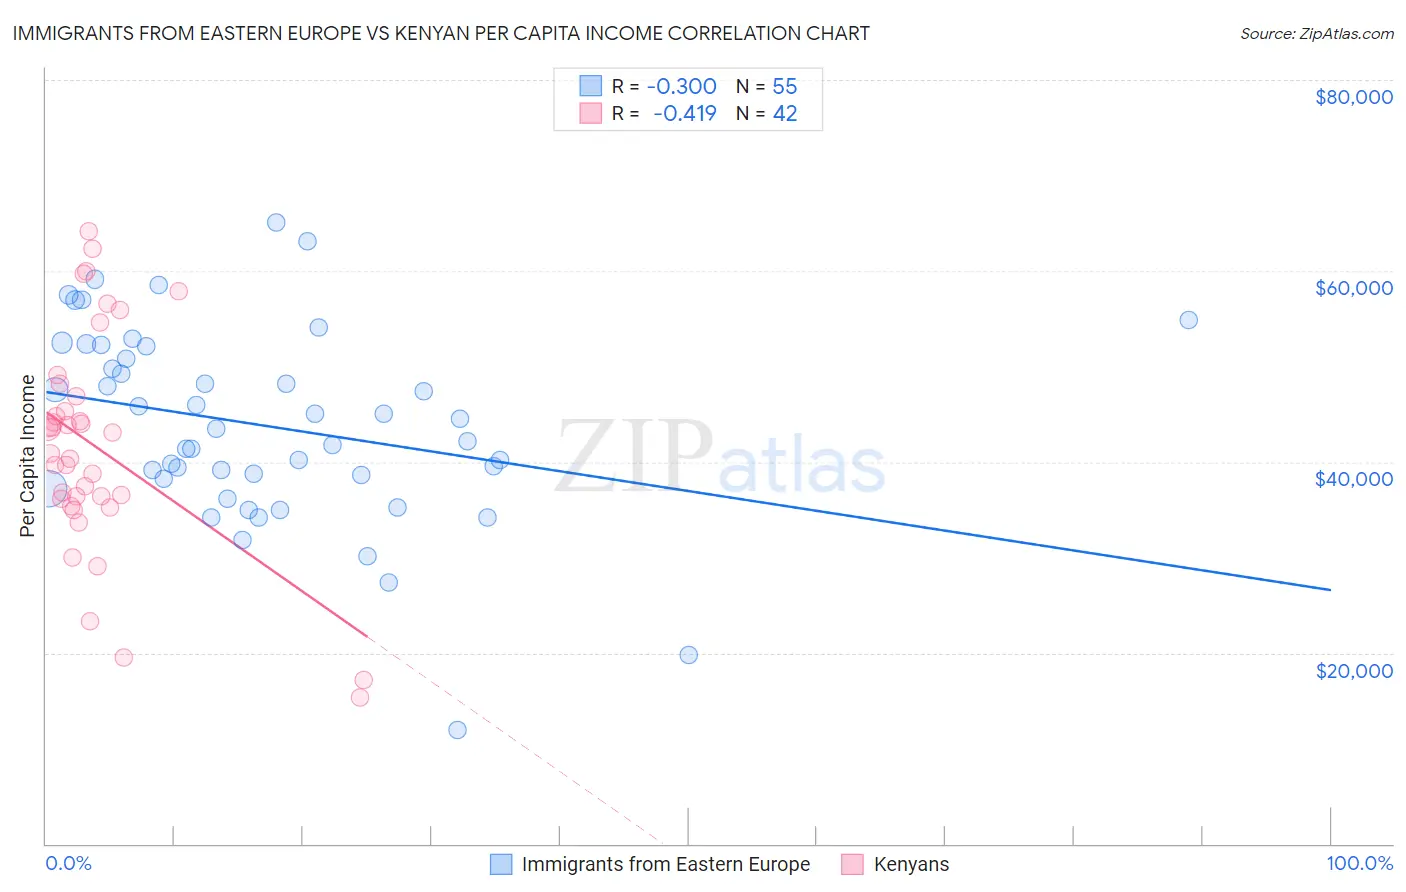
Immigrants from Eastern Europe vs Kenyan Per Capita Income Correlation Chart
The statistical analysis conducted on geographies consisting of 475,909,119 people shows a mild negative correlation between the proportion of Immigrants from Eastern Europe and per capita income in the United States with a correlation coefficient (R) of -0.300 and weighted average of $49,316. Similarly, the statistical analysis conducted on geographies consisting of 168,245,574 people shows a moderate negative correlation between the proportion of Kenyans and per capita income in the United States with a correlation coefficient (R) of -0.419 and weighted average of $42,808, a difference of 15.2%.
Per Capita Income Correlation Summary
| Measurement | Immigrants from Eastern Europe | Kenyan |
| Minimum | $11,876 | $15,366 |
| Maximum | $65,115 | $64,188 |
| Range | $53,239 | $48,822 |
| Mean | $43,803 | $41,624 |
| Median | $43,497 | $42,003 |
| Interquartile 25% (IQ1) | $38,232 | $36,158 |
| Interquartile 75% (IQ3) | $52,105 | $46,865 |
| Interquartile Range (IQR) | $13,872 | $10,707 |
| Standard Deviation (Sample) | $10,236 | $11,486 |
| Standard Deviation (Population) | $10,143 | $11,348 |
Similar Demographics by Per Capita Income
Demographics Similar to Immigrants from Eastern Europe by Per Capita Income
In terms of per capita income, the demographic groups most similar to Immigrants from Eastern Europe are Greek ($49,309, a difference of 0.010%), Immigrants from Hungary ($49,303, a difference of 0.030%), Immigrants from North America ($49,302, a difference of 0.030%), Immigrants from Canada ($49,412, a difference of 0.20%), and Lithuanian ($49,448, a difference of 0.27%).
| Demographics | Rating | Rank | Per Capita Income |
| Maltese | 99.9 /100 | #63 | Exceptional $49,640 |
| Immigrants | Argentina | 99.9 /100 | #64 | Exceptional $49,627 |
| Bolivians | 99.9 /100 | #65 | Exceptional $49,526 |
| Immigrants | Bulgaria | 99.9 /100 | #66 | Exceptional $49,482 |
| Immigrants | Romania | 99.9 /100 | #67 | Exceptional $49,463 |
| Lithuanians | 99.8 /100 | #68 | Exceptional $49,448 |
| Immigrants | Canada | 99.8 /100 | #69 | Exceptional $49,412 |
| Immigrants | Eastern Europe | 99.8 /100 | #70 | Exceptional $49,316 |
| Greeks | 99.8 /100 | #71 | Exceptional $49,309 |
| Immigrants | Hungary | 99.8 /100 | #72 | Exceptional $49,303 |
| Immigrants | North America | 99.8 /100 | #73 | Exceptional $49,302 |
| Mongolians | 99.8 /100 | #74 | Exceptional $49,173 |
| Immigrants | Bolivia | 99.7 /100 | #75 | Exceptional $48,970 |
| Immigrants | England | 99.7 /100 | #76 | Exceptional $48,844 |
| Immigrants | Kazakhstan | 99.7 /100 | #77 | Exceptional $48,747 |
Demographics Similar to Kenyans by Per Capita Income
In terms of per capita income, the demographic groups most similar to Kenyans are Yugoslavian ($42,792, a difference of 0.040%), Iraqi ($42,760, a difference of 0.11%), Immigrants from Sierra Leone ($42,752, a difference of 0.13%), Bermudan ($42,911, a difference of 0.24%), and Immigrants from Fiji ($42,694, a difference of 0.27%).
| Demographics | Rating | Rank | Per Capita Income |
| Germans | 33.9 /100 | #183 | Fair $43,067 |
| Spaniards | 32.9 /100 | #184 | Fair $43,028 |
| Immigrants | Immigrants | 32.5 /100 | #185 | Fair $43,010 |
| French Canadians | 32.3 /100 | #186 | Fair $43,003 |
| Immigrants | Colombia | 31.5 /100 | #187 | Fair $42,971 |
| Immigrants | Africa | 31.0 /100 | #188 | Fair $42,950 |
| Bermudans | 30.1 /100 | #189 | Fair $42,911 |
| Kenyans | 27.7 /100 | #190 | Fair $42,808 |
| Yugoslavians | 27.4 /100 | #191 | Fair $42,792 |
| Iraqis | 26.7 /100 | #192 | Fair $42,760 |
| Immigrants | Sierra Leone | 26.5 /100 | #193 | Fair $42,752 |
| Immigrants | Fiji | 25.2 /100 | #194 | Fair $42,694 |
| Immigrants | Kenya | 24.5 /100 | #195 | Fair $42,661 |
| Dutch | 23.4 /100 | #196 | Fair $42,605 |
| Scotch-Irish | 22.6 /100 | #197 | Fair $42,563 |