Immigrants from Eastern Africa vs Immigrants from Venezuela Householder Income Ages 45 - 64 years
COMPARE
Immigrants from Eastern Africa
Immigrants from Venezuela
Householder Income Ages 45 - 64 years
Householder Income Ages 45 - 64 years Comparison
Immigrants from Eastern Africa
Immigrants from Venezuela
$98,467
HOUSEHOLDER INCOME AGES 45 - 64 YEARS
28.3/ 100
METRIC RATING
196th/ 347
METRIC RANK
$95,342
HOUSEHOLDER INCOME AGES 45 - 64 YEARS
7.6/ 100
METRIC RATING
216th/ 347
METRIC RANK
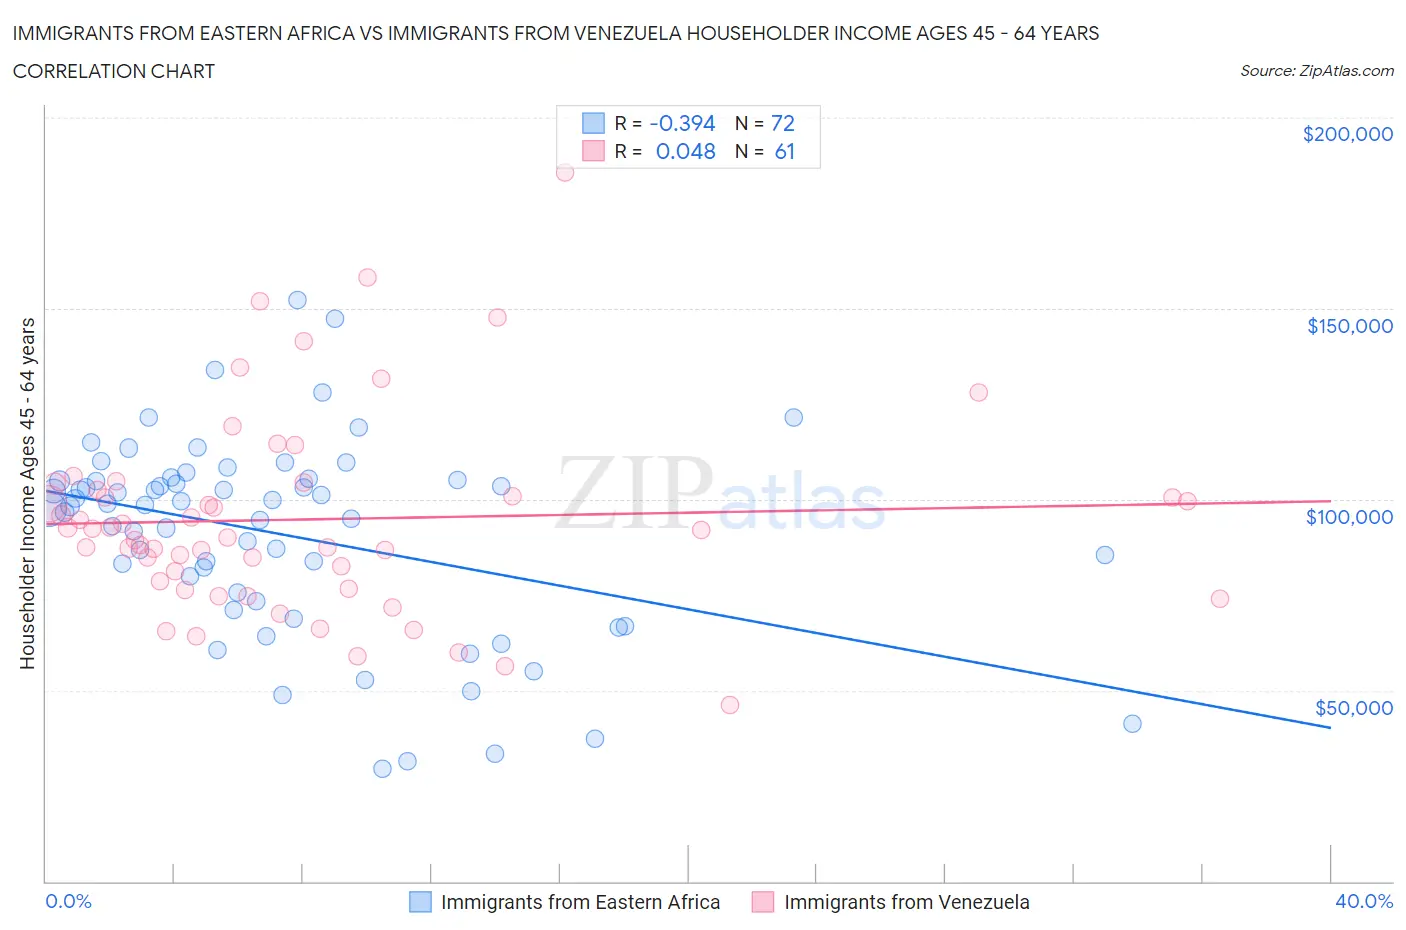
Immigrants from Eastern Africa vs Immigrants from Venezuela Householder Income Ages 45 - 64 years Correlation Chart
The statistical analysis conducted on geographies consisting of 354,576,754 people shows a mild negative correlation between the proportion of Immigrants from Eastern Africa and household income with householder between the ages 45 and 64 in the United States with a correlation coefficient (R) of -0.394 and weighted average of $98,467. Similarly, the statistical analysis conducted on geographies consisting of 287,624,834 people shows no correlation between the proportion of Immigrants from Venezuela and household income with householder between the ages 45 and 64 in the United States with a correlation coefficient (R) of 0.048 and weighted average of $95,342, a difference of 3.3%.
Householder Income Ages 45 - 64 years Correlation Summary
| Measurement | Immigrants from Eastern Africa | Immigrants from Venezuela |
| Minimum | $29,590 | $46,250 |
| Maximum | $152,098 | $185,667 |
| Range | $122,508 | $139,417 |
| Mean | $90,687 | $94,774 |
| Median | $98,438 | $91,875 |
| Interquartile 25% (IQ1) | $74,490 | $77,515 |
| Interquartile 75% (IQ3) | $104,938 | $103,326 |
| Interquartile Range (IQR) | $30,447 | $25,811 |
| Standard Deviation (Sample) | $25,936 | $26,075 |
| Standard Deviation (Population) | $25,755 | $25,861 |
Demographics Similar to Immigrants from Eastern Africa and Immigrants from Venezuela by Householder Income Ages 45 - 64 years
In terms of householder income ages 45 - 64 years, the demographic groups most similar to Immigrants from Eastern Africa are Puget Sound Salish ($98,340, a difference of 0.13%), Immigrants from Iraq ($98,201, a difference of 0.27%), White/Caucasian ($98,091, a difference of 0.38%), Immigrants from Kenya ($97,964, a difference of 0.51%), and Yugoslavian ($97,558, a difference of 0.93%). Similarly, the demographic groups most similar to Immigrants from Venezuela are Nigerian ($95,492, a difference of 0.16%), Panamanian ($96,066, a difference of 0.76%), Immigrants from Uruguay ($96,086, a difference of 0.78%), Venezuelan ($96,460, a difference of 1.2%), and Immigrants from Cambodia ($96,537, a difference of 1.3%).
| Demographics | Rating | Rank | Householder Income Ages 45 - 64 years |
| Immigrants | Eastern Africa | 28.3 /100 | #196 | Fair $98,467 |
| Puget Sound Salish | 27.0 /100 | #197 | Fair $98,340 |
| Immigrants | Iraq | 25.7 /100 | #198 | Fair $98,201 |
| Whites/Caucasians | 24.6 /100 | #199 | Fair $98,091 |
| Immigrants | Kenya | 23.5 /100 | #200 | Fair $97,964 |
| Yugoslavians | 20.0 /100 | #201 | Fair $97,558 |
| Tlingit-Haida | 18.9 /100 | #202 | Poor $97,417 |
| Immigrants | Thailand | 18.8 /100 | #203 | Poor $97,400 |
| Immigrants | Eritrea | 18.6 /100 | #204 | Poor $97,373 |
| Immigrants | Colombia | 18.0 /100 | #205 | Poor $97,290 |
| Immigrants | Africa | 17.9 /100 | #206 | Poor $97,284 |
| Ghanaians | 17.9 /100 | #207 | Poor $97,277 |
| Scotch-Irish | 16.4 /100 | #208 | Poor $97,073 |
| Japanese | 14.8 /100 | #209 | Poor $96,834 |
| Tsimshian | 14.5 /100 | #210 | Poor $96,783 |
| Immigrants | Cambodia | 13.0 /100 | #211 | Poor $96,537 |
| Venezuelans | 12.6 /100 | #212 | Poor $96,460 |
| Immigrants | Uruguay | 10.7 /100 | #213 | Poor $96,086 |
| Panamanians | 10.6 /100 | #214 | Poor $96,066 |
| Nigerians | 8.2 /100 | #215 | Tragic $95,492 |
| Immigrants | Venezuela | 7.6 /100 | #216 | Tragic $95,342 |