Immigrants from Dominican Republic vs Tongan Wage/Income Gap
COMPARE
Immigrants from Dominican Republic
Tongan
Wage/Income Gap
Wage/Income Gap Comparison
Immigrants from Dominican Republic
Tongans
20.6%
WAGE/INCOME GAP
100.0/ 100
METRIC RATING
23rd/ 347
METRIC RANK
27.5%
WAGE/INCOME GAP
1.7/ 100
METRIC RATING
260th/ 347
METRIC RANK
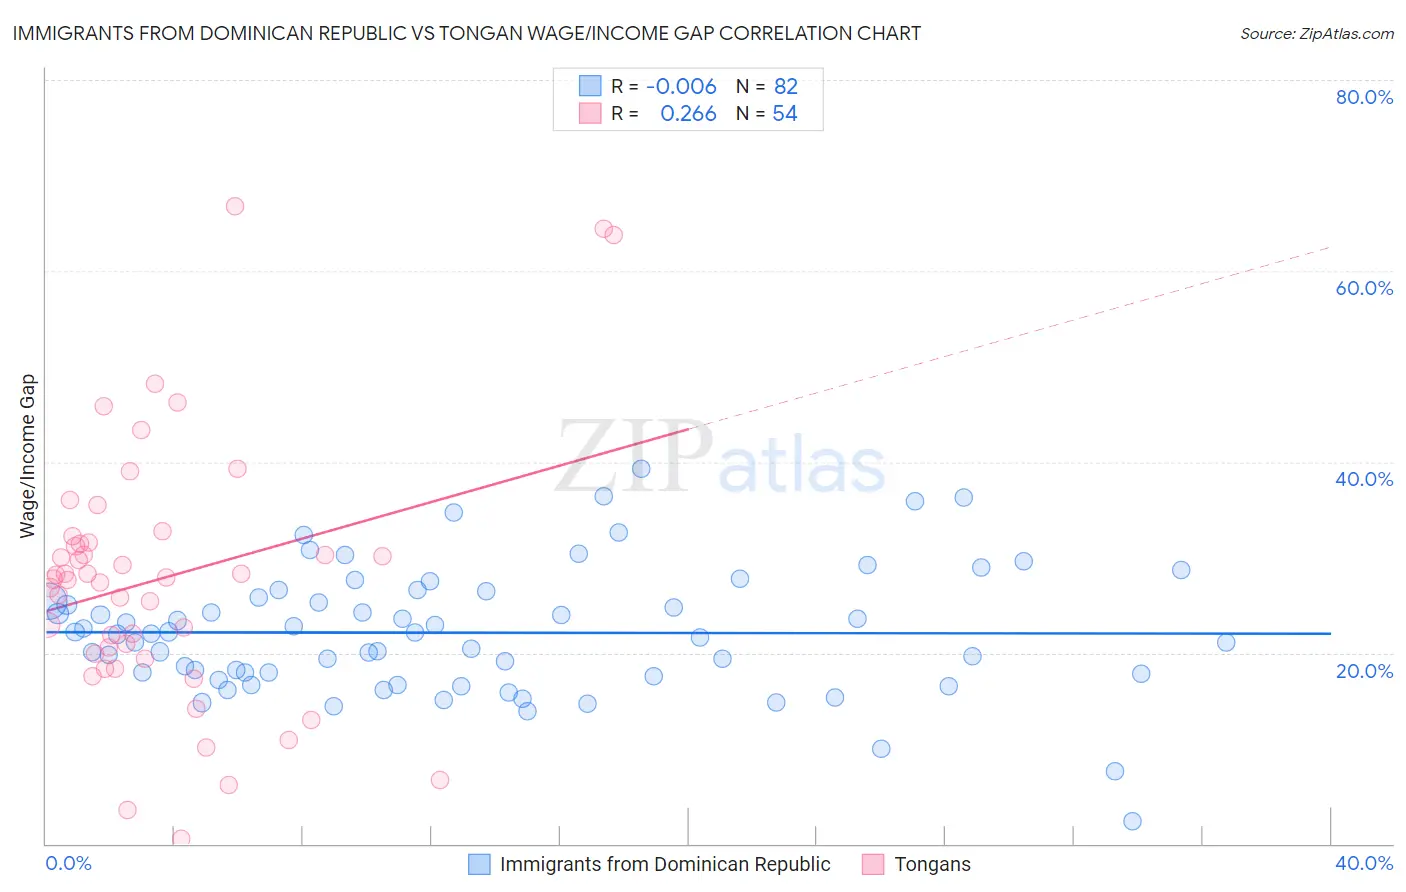
Immigrants from Dominican Republic vs Tongan Wage/Income Gap Correlation Chart
The statistical analysis conducted on geographies consisting of 274,970,009 people shows no correlation between the proportion of Immigrants from Dominican Republic and wage/income gap percentage in the United States with a correlation coefficient (R) of -0.006 and weighted average of 20.6%. Similarly, the statistical analysis conducted on geographies consisting of 102,896,342 people shows a weak positive correlation between the proportion of Tongans and wage/income gap percentage in the United States with a correlation coefficient (R) of 0.266 and weighted average of 27.5%, a difference of 33.6%.
Wage/Income Gap Correlation Summary
| Measurement | Immigrants from Dominican Republic | Tongan |
| Minimum | 2.4% | 0.48% |
| Maximum | 39.3% | 66.8% |
| Range | 36.9% | 66.3% |
| Mean | 22.1% | 27.8% |
| Median | 22.0% | 27.8% |
| Interquartile 25% (IQ1) | 17.7% | 20.0% |
| Interquartile 75% (IQ3) | 25.7% | 31.6% |
| Interquartile Range (IQR) | 8.0% | 11.6% |
| Standard Deviation (Sample) | 6.6% | 13.7% |
| Standard Deviation (Population) | 6.6% | 13.6% |
Similar Demographics by Wage/Income Gap
Demographics Similar to Immigrants from Dominican Republic by Wage/Income Gap
In terms of wage/income gap, the demographic groups most similar to Immigrants from Dominican Republic are Immigrants from Liberia (20.6%, a difference of 0.020%), Dominican (20.6%, a difference of 0.17%), Senegalese (20.7%, a difference of 0.47%), Pueblo (20.7%, a difference of 0.58%), and Immigrants from Armenia (20.7%, a difference of 0.78%).
| Demographics | Rating | Rank | Wage/Income Gap |
| Jamaicans | 100.0 /100 | #16 | Exceptional 19.6% |
| Haitians | 100.0 /100 | #17 | Exceptional 19.7% |
| Hopi | 100.0 /100 | #18 | Exceptional 20.0% |
| Immigrants | Dominica | 100.0 /100 | #19 | Exceptional 20.0% |
| Bahamians | 100.0 /100 | #20 | Exceptional 20.2% |
| Immigrants | Caribbean | 100.0 /100 | #21 | Exceptional 20.4% |
| Immigrants | Liberia | 100.0 /100 | #22 | Exceptional 20.6% |
| Immigrants | Dominican Republic | 100.0 /100 | #23 | Exceptional 20.6% |
| Dominicans | 100.0 /100 | #24 | Exceptional 20.6% |
| Senegalese | 100.0 /100 | #25 | Exceptional 20.7% |
| Pueblo | 100.0 /100 | #26 | Exceptional 20.7% |
| Immigrants | Armenia | 100.0 /100 | #27 | Exceptional 20.7% |
| Inupiat | 100.0 /100 | #28 | Exceptional 20.8% |
| Immigrants | Senegal | 100.0 /100 | #29 | Exceptional 20.9% |
| Immigrants | Bangladesh | 100.0 /100 | #30 | Exceptional 20.9% |
Demographics Similar to Tongans by Wage/Income Gap
In terms of wage/income gap, the demographic groups most similar to Tongans are Icelander (27.5%, a difference of 0.020%), Slavic (27.4%, a difference of 0.090%), Luxembourger (27.4%, a difference of 0.13%), Cherokee (27.4%, a difference of 0.18%), and Immigrants from Germany (27.5%, a difference of 0.26%).
| Demographics | Rating | Rank | Wage/Income Gap |
| Portuguese | 2.2 /100 | #253 | Tragic 27.4% |
| Israelis | 2.1 /100 | #254 | Tragic 27.4% |
| Immigrants | France | 2.1 /100 | #255 | Tragic 27.4% |
| Cherokee | 1.9 /100 | #256 | Tragic 27.4% |
| Luxembourgers | 1.9 /100 | #257 | Tragic 27.4% |
| Slavs | 1.8 /100 | #258 | Tragic 27.4% |
| Icelanders | 1.8 /100 | #259 | Tragic 27.5% |
| Tongans | 1.7 /100 | #260 | Tragic 27.5% |
| Immigrants | Germany | 1.5 /100 | #261 | Tragic 27.5% |
| Immigrants | Lebanon | 1.5 /100 | #262 | Tragic 27.5% |
| Syrians | 1.4 /100 | #263 | Tragic 27.6% |
| Immigrants | Switzerland | 1.0 /100 | #264 | Tragic 27.7% |
| Serbians | 1.0 /100 | #265 | Tragic 27.7% |
| Hmong | 1.0 /100 | #266 | Tragic 27.7% |
| Turks | 1.0 /100 | #267 | Tragic 27.7% |