Immigrants from Dominican Republic vs Thai Householder Income Ages 45 - 64 years
COMPARE
Immigrants from Dominican Republic
Thai
Householder Income Ages 45 - 64 years
Householder Income Ages 45 - 64 years Comparison
Immigrants from Dominican Republic
Thais
$78,836
HOUSEHOLDER INCOME AGES 45 - 64 YEARS
0.0/ 100
METRIC RATING
331st/ 347
METRIC RANK
$129,560
HOUSEHOLDER INCOME AGES 45 - 64 YEARS
100.0/ 100
METRIC RATING
4th/ 347
METRIC RANK
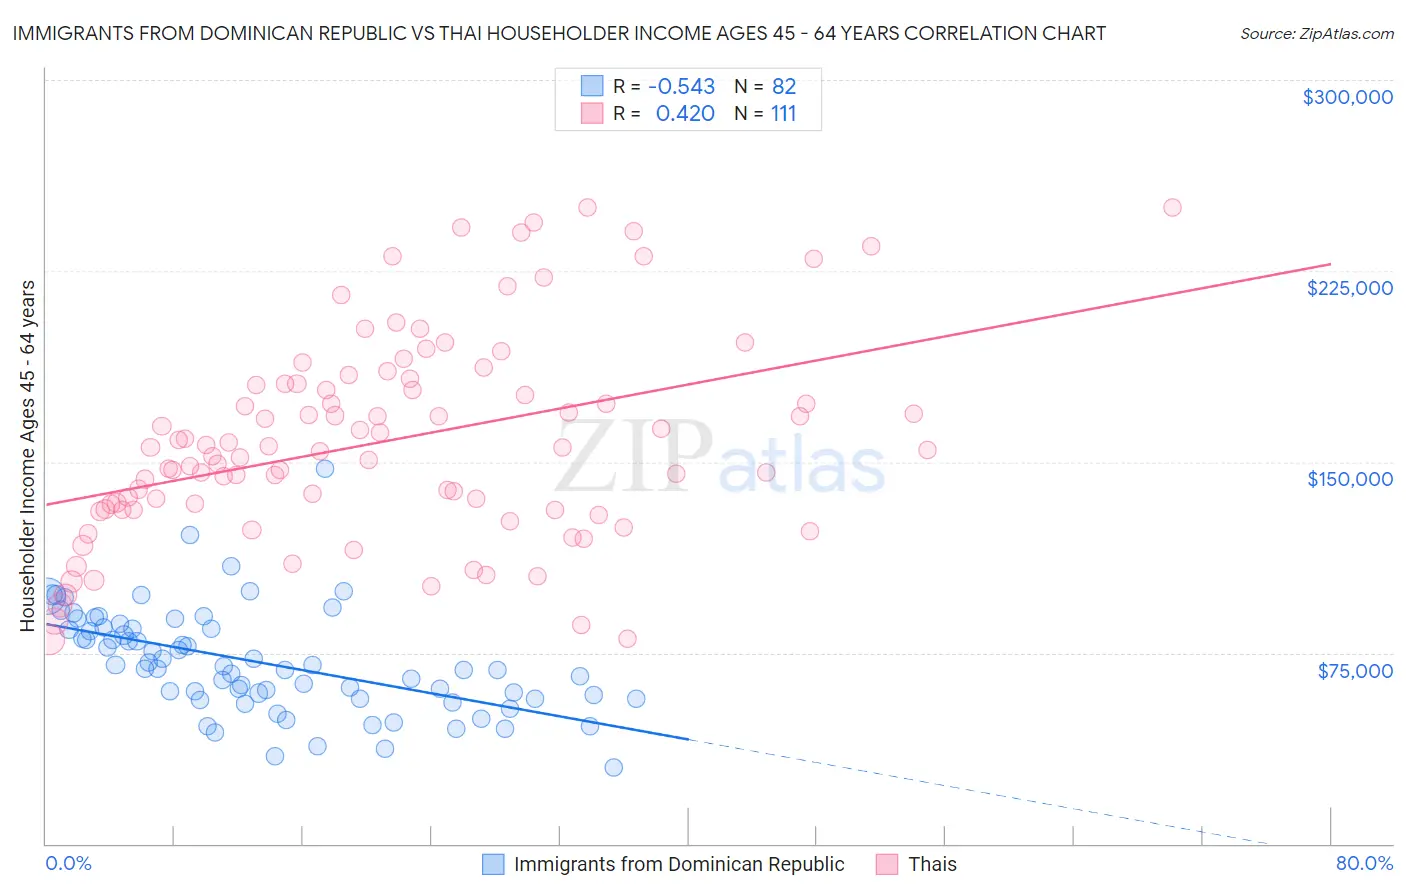
Immigrants from Dominican Republic vs Thai Householder Income Ages 45 - 64 years Correlation Chart
The statistical analysis conducted on geographies consisting of 274,687,311 people shows a substantial negative correlation between the proportion of Immigrants from Dominican Republic and household income with householder between the ages 45 and 64 in the United States with a correlation coefficient (R) of -0.543 and weighted average of $78,836. Similarly, the statistical analysis conducted on geographies consisting of 474,584,420 people shows a moderate positive correlation between the proportion of Thais and household income with householder between the ages 45 and 64 in the United States with a correlation coefficient (R) of 0.420 and weighted average of $129,560, a difference of 64.3%.
Householder Income Ages 45 - 64 years Correlation Summary
| Measurement | Immigrants from Dominican Republic | Thai |
| Minimum | $30,156 | $80,277 |
| Maximum | $147,500 | $250,001 |
| Range | $117,344 | $169,724 |
| Mean | $71,398 | $158,060 |
| Median | $69,228 | $154,550 |
| Interquartile 25% (IQ1) | $57,193 | $131,303 |
| Interquartile 75% (IQ3) | $84,653 | $180,581 |
| Interquartile Range (IQR) | $27,460 | $49,278 |
| Standard Deviation (Sample) | $20,395 | $39,812 |
| Standard Deviation (Population) | $20,271 | $39,632 |
Similar Demographics by Householder Income Ages 45 - 64 years
Demographics Similar to Immigrants from Dominican Republic by Householder Income Ages 45 - 64 years
In terms of householder income ages 45 - 64 years, the demographic groups most similar to Immigrants from Dominican Republic are Creek ($78,960, a difference of 0.16%), Black/African American ($78,556, a difference of 0.36%), Dutch West Indian ($79,171, a difference of 0.42%), Native/Alaskan ($79,816, a difference of 1.2%), and Immigrants from Congo ($77,850, a difference of 1.3%).
| Demographics | Rating | Rank | Householder Income Ages 45 - 64 years |
| Yup'ik | 0.0 /100 | #324 | Tragic $81,000 |
| Immigrants | Cuba | 0.0 /100 | #325 | Tragic $80,662 |
| Dominicans | 0.0 /100 | #326 | Tragic $80,623 |
| Seminole | 0.0 /100 | #327 | Tragic $80,077 |
| Natives/Alaskans | 0.0 /100 | #328 | Tragic $79,816 |
| Dutch West Indians | 0.0 /100 | #329 | Tragic $79,171 |
| Creek | 0.0 /100 | #330 | Tragic $78,960 |
| Immigrants | Dominican Republic | 0.0 /100 | #331 | Tragic $78,836 |
| Blacks/African Americans | 0.0 /100 | #332 | Tragic $78,556 |
| Immigrants | Congo | 0.0 /100 | #333 | Tragic $77,850 |
| Menominee | 0.0 /100 | #334 | Tragic $76,903 |
| Cheyenne | 0.0 /100 | #335 | Tragic $76,362 |
| Arapaho | 0.0 /100 | #336 | Tragic $75,945 |
| Pueblo | 0.0 /100 | #337 | Tragic $75,601 |
| Hopi | 0.0 /100 | #338 | Tragic $75,562 |
Demographics Similar to Thais by Householder Income Ages 45 - 64 years
In terms of householder income ages 45 - 64 years, the demographic groups most similar to Thais are Immigrants from Singapore ($129,514, a difference of 0.040%), Iranian ($129,350, a difference of 0.16%), Immigrants from Hong Kong ($127,500, a difference of 1.6%), Immigrants from Iran ($126,940, a difference of 2.1%), and Immigrants from India ($132,488, a difference of 2.3%).
| Demographics | Rating | Rank | Householder Income Ages 45 - 64 years |
| Immigrants | Taiwan | 100.0 /100 | #1 | Exceptional $135,508 |
| Filipinos | 100.0 /100 | #2 | Exceptional $134,910 |
| Immigrants | India | 100.0 /100 | #3 | Exceptional $132,488 |
| Thais | 100.0 /100 | #4 | Exceptional $129,560 |
| Immigrants | Singapore | 100.0 /100 | #5 | Exceptional $129,514 |
| Iranians | 100.0 /100 | #6 | Exceptional $129,350 |
| Immigrants | Hong Kong | 100.0 /100 | #7 | Exceptional $127,500 |
| Immigrants | Iran | 100.0 /100 | #8 | Exceptional $126,940 |
| Okinawans | 100.0 /100 | #9 | Exceptional $124,796 |
| Immigrants | South Central Asia | 100.0 /100 | #10 | Exceptional $124,188 |
| Cypriots | 100.0 /100 | #11 | Exceptional $123,396 |
| Immigrants | Israel | 100.0 /100 | #12 | Exceptional $122,893 |
| Immigrants | Ireland | 100.0 /100 | #13 | Exceptional $122,757 |
| Indians (Asian) | 100.0 /100 | #14 | Exceptional $122,343 |
| Immigrants | Eastern Asia | 100.0 /100 | #15 | Exceptional $122,222 |