Immigrants from Dominican Republic vs Immigrants from Western Asia Householder Income Ages 45 - 64 years
COMPARE
Immigrants from Dominican Republic
Immigrants from Western Asia
Householder Income Ages 45 - 64 years
Householder Income Ages 45 - 64 years Comparison
Immigrants from Dominican Republic
Immigrants from Western Asia
$78,836
HOUSEHOLDER INCOME AGES 45 - 64 YEARS
0.0/ 100
METRIC RATING
331st/ 347
METRIC RANK
$106,217
HOUSEHOLDER INCOME AGES 45 - 64 YEARS
95.0/ 100
METRIC RATING
118th/ 347
METRIC RANK
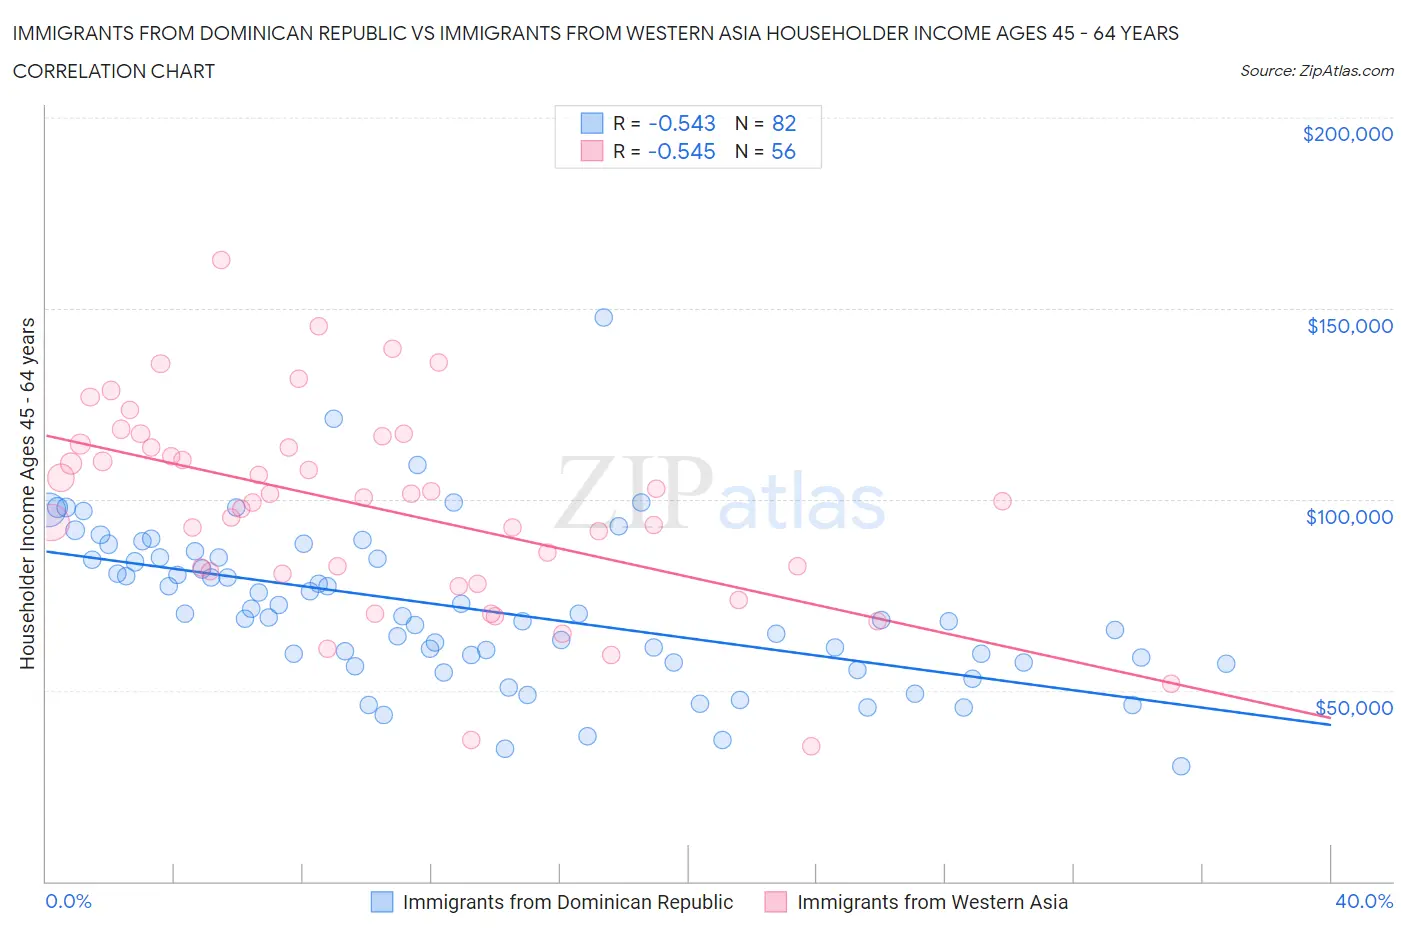
Immigrants from Dominican Republic vs Immigrants from Western Asia Householder Income Ages 45 - 64 years Correlation Chart
The statistical analysis conducted on geographies consisting of 274,687,311 people shows a substantial negative correlation between the proportion of Immigrants from Dominican Republic and household income with householder between the ages 45 and 64 in the United States with a correlation coefficient (R) of -0.543 and weighted average of $78,836. Similarly, the statistical analysis conducted on geographies consisting of 403,788,110 people shows a substantial negative correlation between the proportion of Immigrants from Western Asia and household income with householder between the ages 45 and 64 in the United States with a correlation coefficient (R) of -0.545 and weighted average of $106,217, a difference of 34.7%.
Householder Income Ages 45 - 64 years Correlation Summary
| Measurement | Immigrants from Dominican Republic | Immigrants from Western Asia |
| Minimum | $30,156 | $35,250 |
| Maximum | $147,500 | $162,741 |
| Range | $117,344 | $127,491 |
| Mean | $71,398 | $97,778 |
| Median | $69,228 | $100,060 |
| Interquartile 25% (IQ1) | $57,193 | $80,918 |
| Interquartile 75% (IQ3) | $84,653 | $113,930 |
| Interquartile Range (IQR) | $27,460 | $33,012 |
| Standard Deviation (Sample) | $20,395 | $26,213 |
| Standard Deviation (Population) | $20,271 | $25,977 |
Similar Demographics by Householder Income Ages 45 - 64 years
Demographics Similar to Immigrants from Dominican Republic by Householder Income Ages 45 - 64 years
In terms of householder income ages 45 - 64 years, the demographic groups most similar to Immigrants from Dominican Republic are Creek ($78,960, a difference of 0.16%), Black/African American ($78,556, a difference of 0.36%), Dutch West Indian ($79,171, a difference of 0.42%), Native/Alaskan ($79,816, a difference of 1.2%), and Immigrants from Congo ($77,850, a difference of 1.3%).
| Demographics | Rating | Rank | Householder Income Ages 45 - 64 years |
| Yup'ik | 0.0 /100 | #324 | Tragic $81,000 |
| Immigrants | Cuba | 0.0 /100 | #325 | Tragic $80,662 |
| Dominicans | 0.0 /100 | #326 | Tragic $80,623 |
| Seminole | 0.0 /100 | #327 | Tragic $80,077 |
| Natives/Alaskans | 0.0 /100 | #328 | Tragic $79,816 |
| Dutch West Indians | 0.0 /100 | #329 | Tragic $79,171 |
| Creek | 0.0 /100 | #330 | Tragic $78,960 |
| Immigrants | Dominican Republic | 0.0 /100 | #331 | Tragic $78,836 |
| Blacks/African Americans | 0.0 /100 | #332 | Tragic $78,556 |
| Immigrants | Congo | 0.0 /100 | #333 | Tragic $77,850 |
| Menominee | 0.0 /100 | #334 | Tragic $76,903 |
| Cheyenne | 0.0 /100 | #335 | Tragic $76,362 |
| Arapaho | 0.0 /100 | #336 | Tragic $75,945 |
| Pueblo | 0.0 /100 | #337 | Tragic $75,601 |
| Hopi | 0.0 /100 | #338 | Tragic $75,562 |
Demographics Similar to Immigrants from Western Asia by Householder Income Ages 45 - 64 years
In terms of householder income ages 45 - 64 years, the demographic groups most similar to Immigrants from Western Asia are Albanian ($106,243, a difference of 0.020%), British ($106,264, a difference of 0.040%), Immigrants from Jordan ($106,164, a difference of 0.050%), Immigrants from Kuwait ($106,285, a difference of 0.060%), and Immigrants from Poland ($106,319, a difference of 0.10%).
| Demographics | Rating | Rank | Householder Income Ages 45 - 64 years |
| Immigrants | Vietnam | 95.5 /100 | #111 | Exceptional $106,417 |
| Swedes | 95.4 /100 | #112 | Exceptional $106,377 |
| Europeans | 95.4 /100 | #113 | Exceptional $106,367 |
| Immigrants | Poland | 95.3 /100 | #114 | Exceptional $106,319 |
| Immigrants | Kuwait | 95.2 /100 | #115 | Exceptional $106,285 |
| British | 95.2 /100 | #116 | Exceptional $106,264 |
| Albanians | 95.1 /100 | #117 | Exceptional $106,243 |
| Immigrants | Western Asia | 95.0 /100 | #118 | Exceptional $106,217 |
| Immigrants | Jordan | 94.9 /100 | #119 | Exceptional $106,164 |
| Immigrants | South Eastern Asia | 94.8 /100 | #120 | Exceptional $106,109 |
| Poles | 94.4 /100 | #121 | Exceptional $105,952 |
| Immigrants | North Macedonia | 94.2 /100 | #122 | Exceptional $105,892 |
| Danes | 93.4 /100 | #123 | Exceptional $105,619 |
| Immigrants | Northern Africa | 92.8 /100 | #124 | Exceptional $105,430 |
| Pakistanis | 92.4 /100 | #125 | Exceptional $105,317 |